How to design a perfect subway map?
Posted by Mihaela Rozman on Tuesday, April 16, 2019 · Leave a Comment
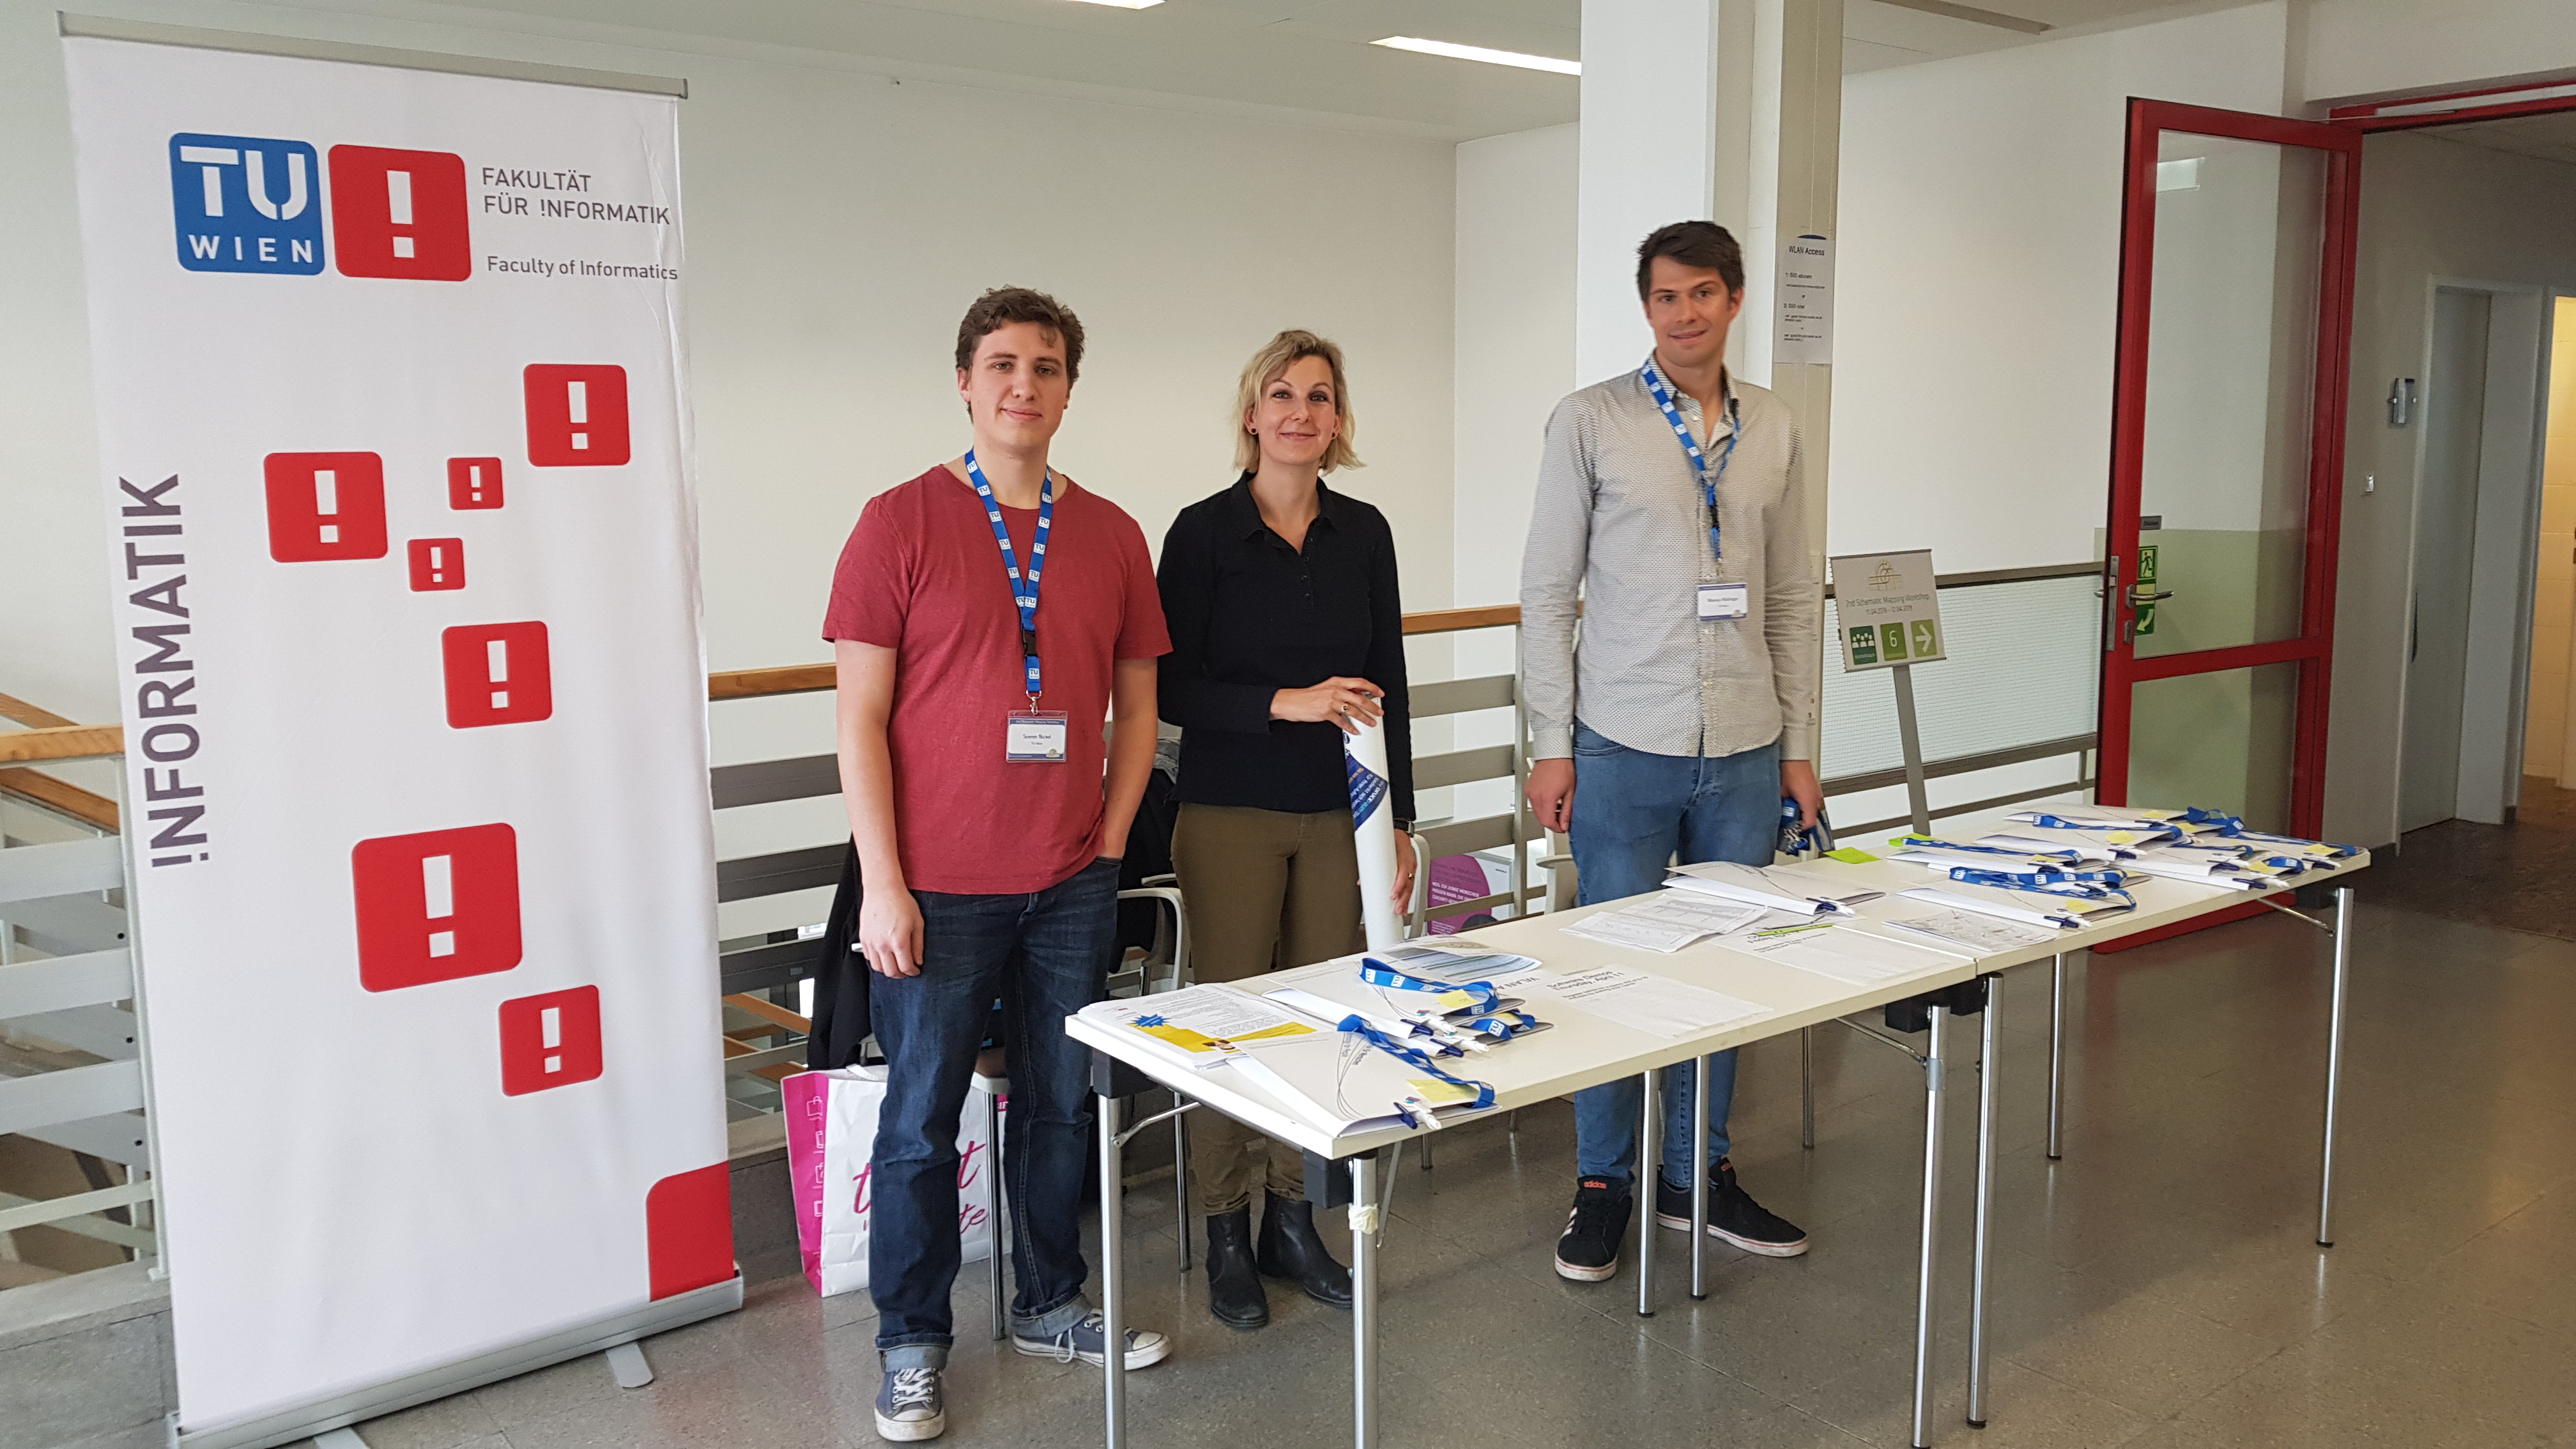
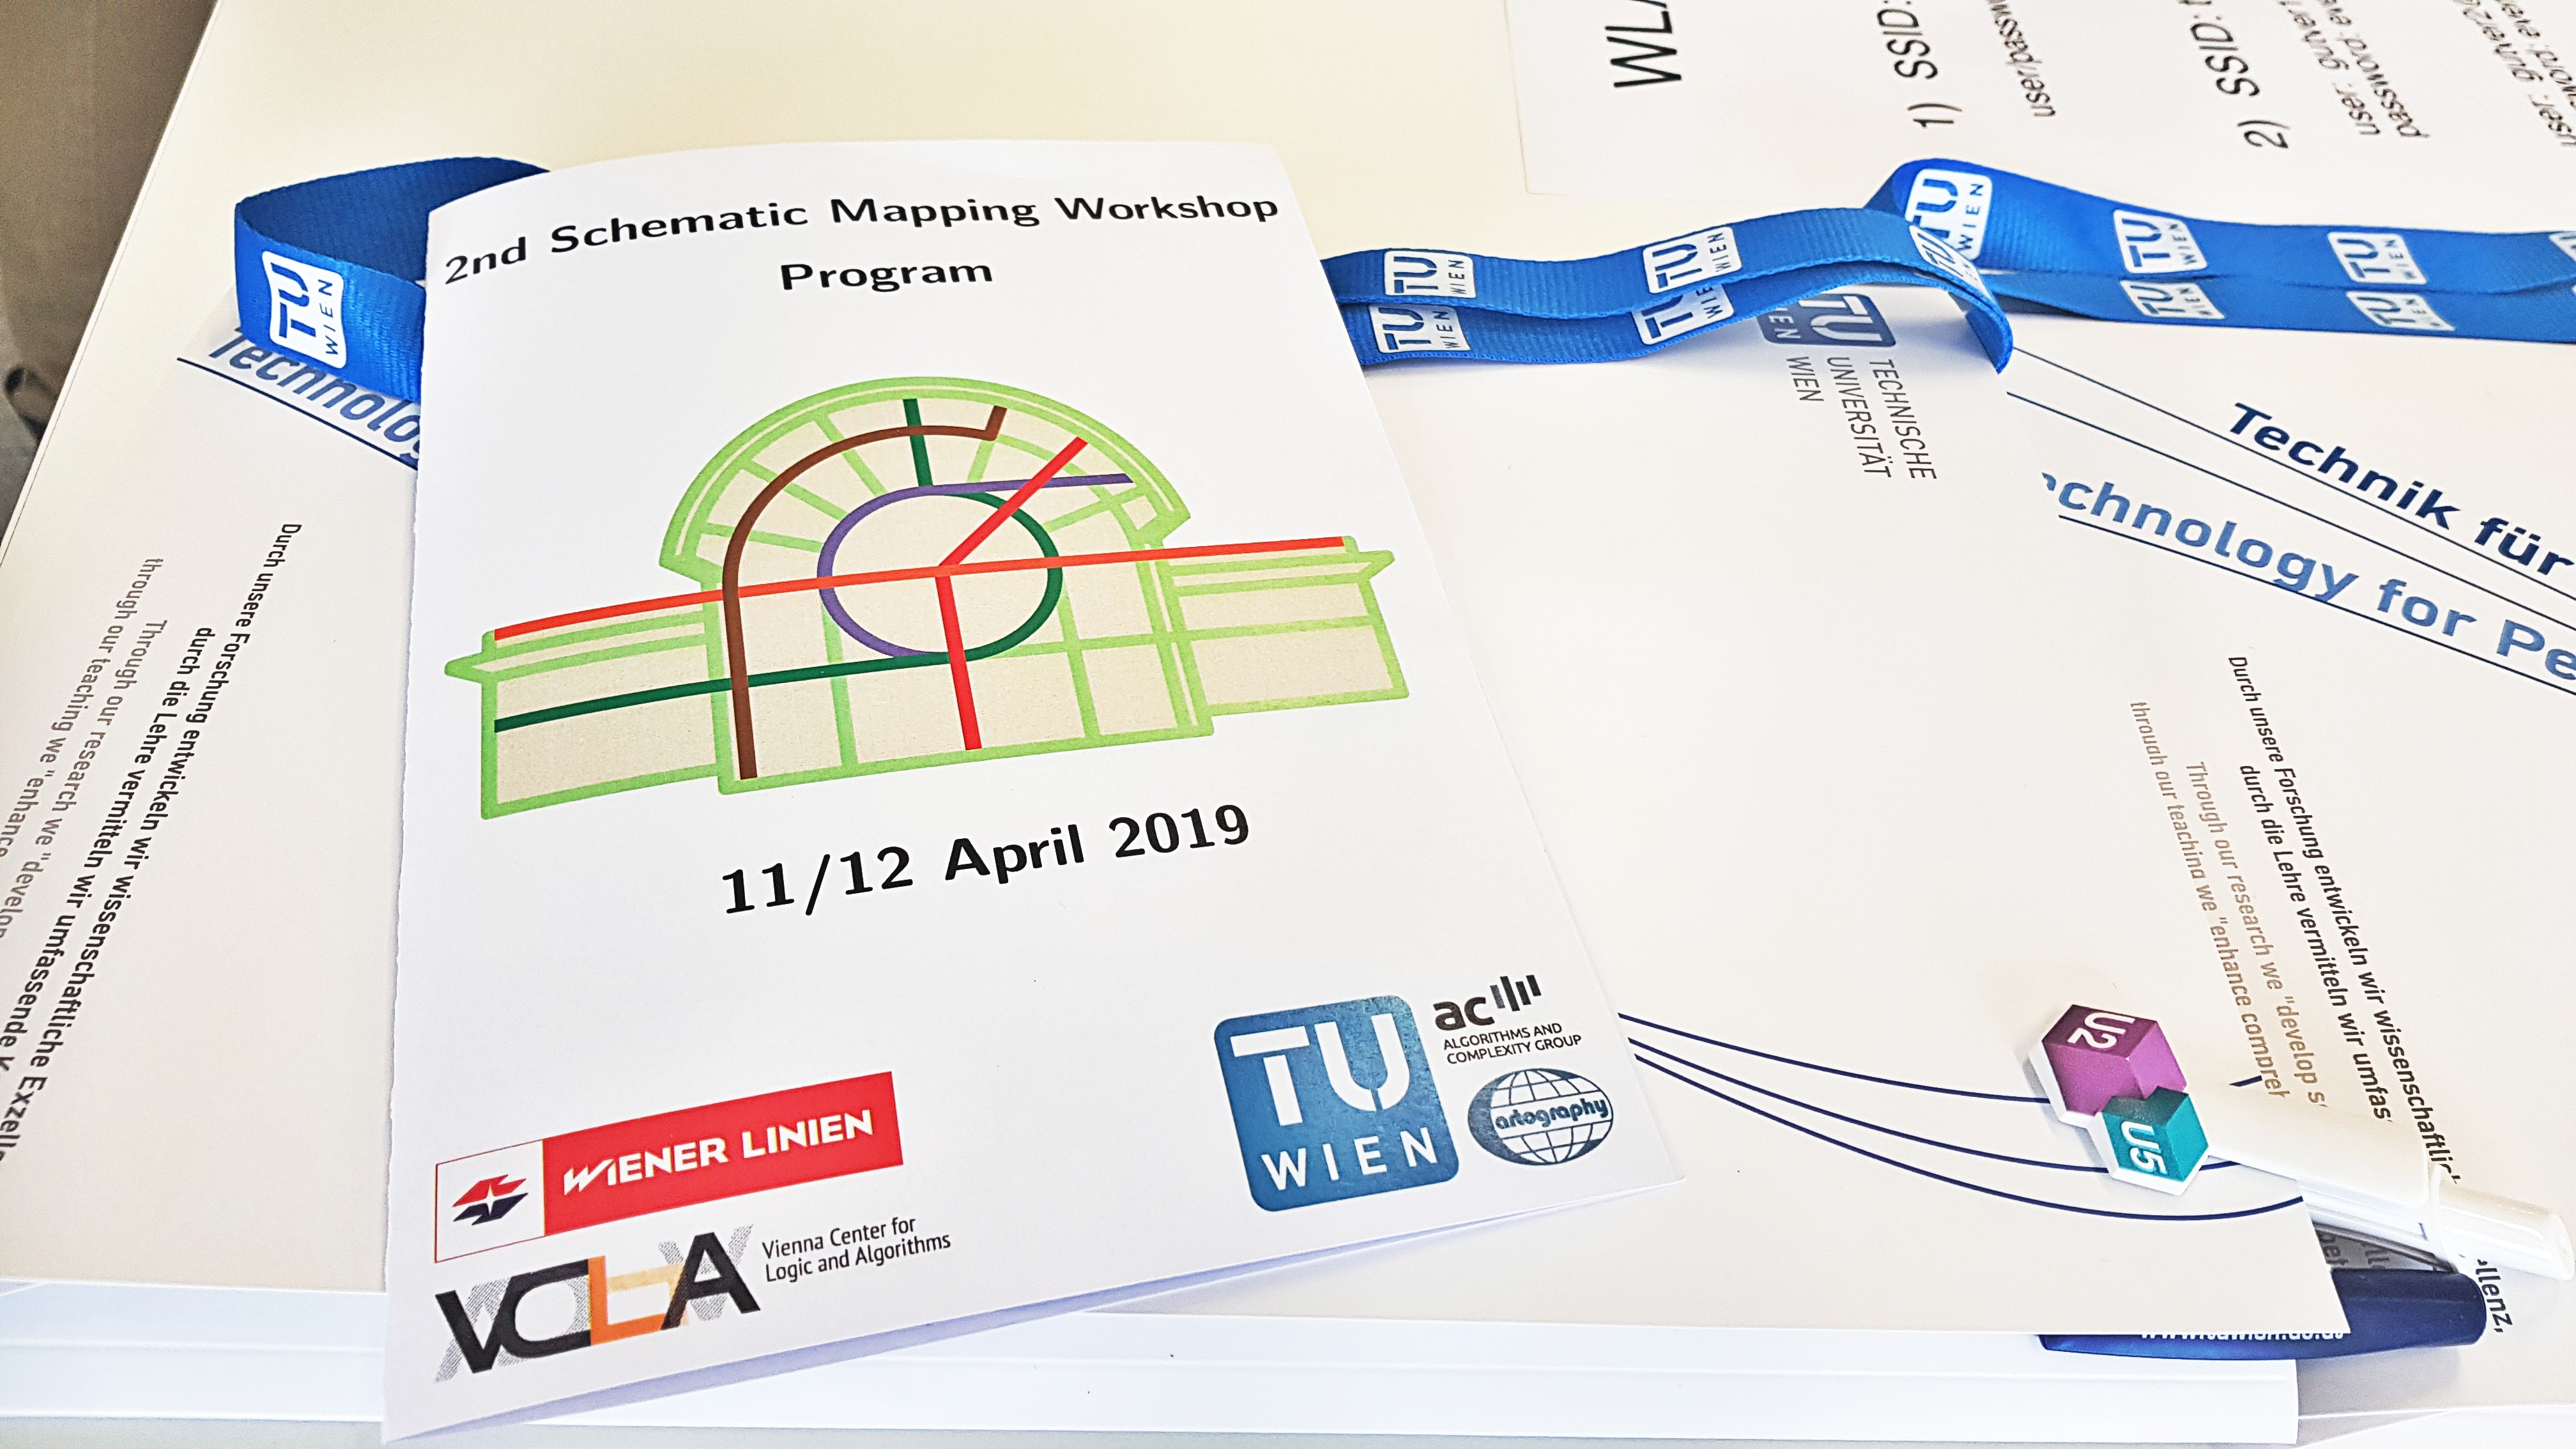
2nd Schematic Mapping Workshop took place at TU Wien
No matter where in the world you travel by public transport, you will come across maps that have simplified routes which turn them into a schematic diagram. Despite the flood of navigation apps, the schematic map remains an important source of information that is widely used to help you plan travelling by public transport. But are they really designed as effectively as possible to provide maximum support to the passengers? Could some of them be improved? How can this be achieved? Cartographers, computer scientists, designers, psychologists and transport experts have discussed these questions and new challenges in the framework of the second “Schematic Mapping Workshop”, taking place on 11 and 12 April 2019 at the TU Wien, after its successful first edition in 2014 at the University of Essex, UK. The workshop was organized under the baton of Georg Gartner (TU Wien), Martin Nöllenburg (TU Wien), and Maxwell Roberts (U. Essex).
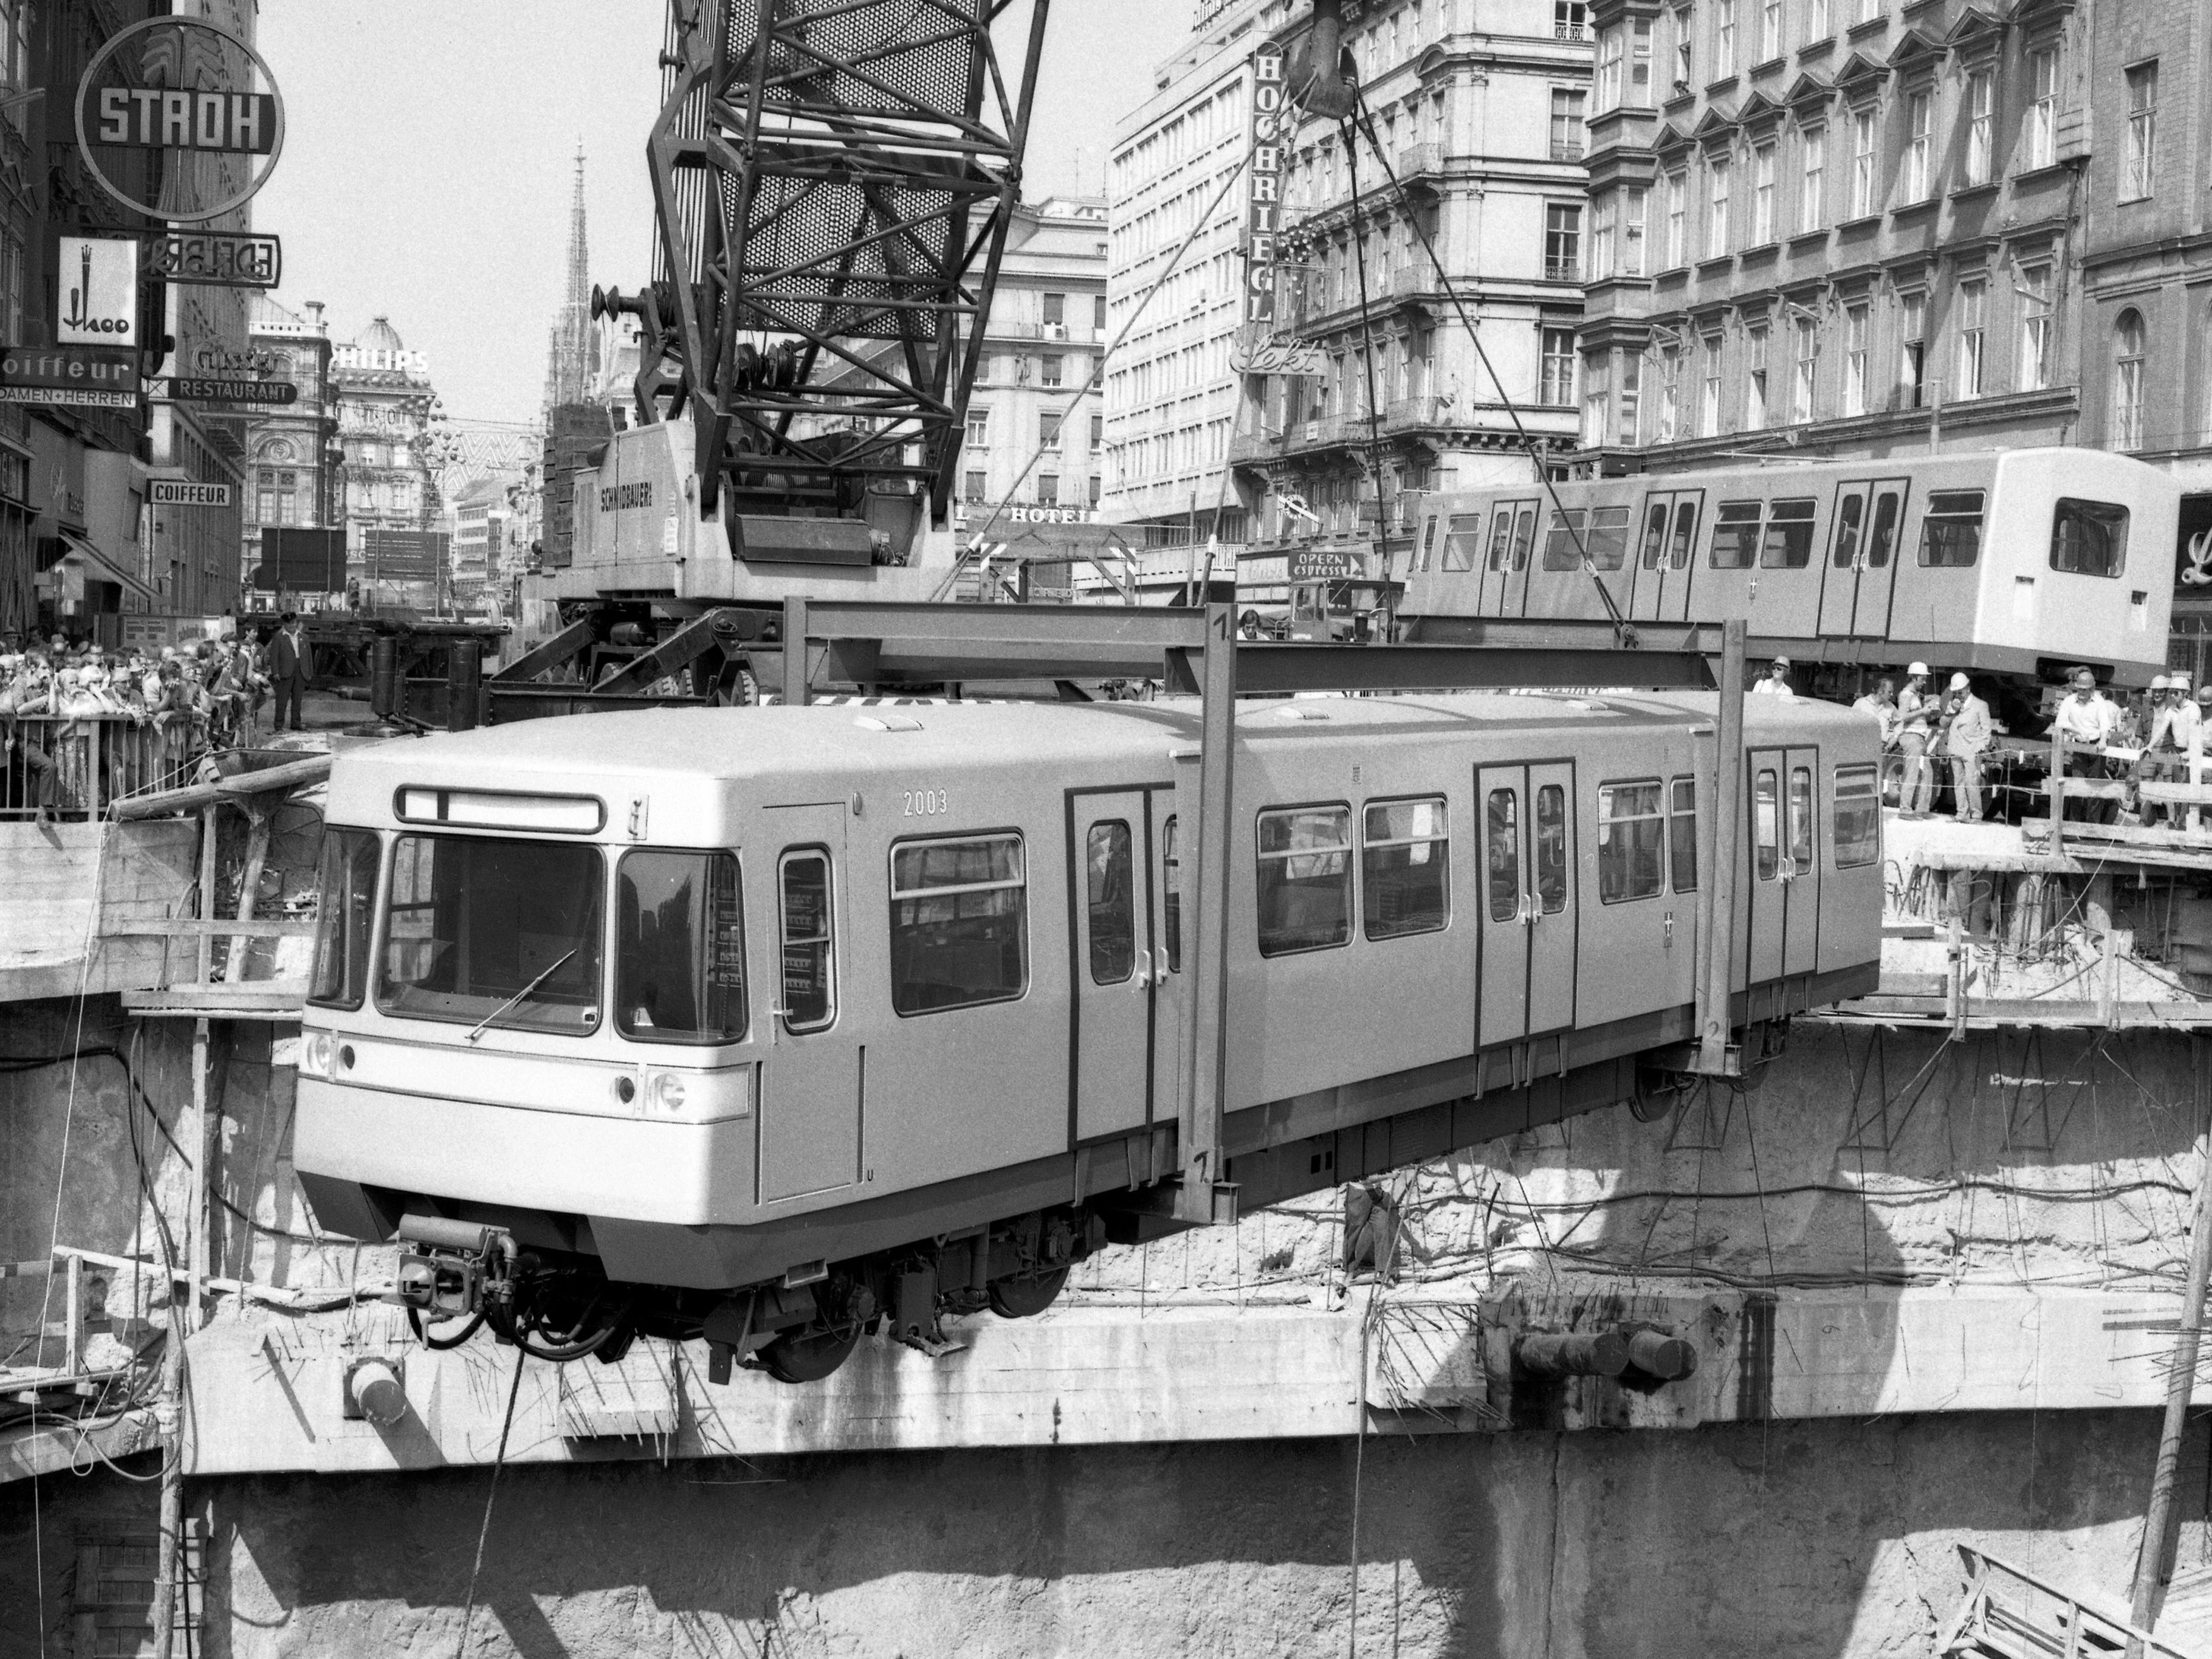 Credit: City of Vienna |
 Logo based on the Vienna subway map. |
The designers of the schematic maps are responsible for providing the people with the information most of them need to plan the travels. The provided information should be clear and unambiguous. A mathematical analysis suggests that our brain has limited ability to understand schematic maps. Unnecessary information is an obstacle for the user and leads to so-called “information pollution”. The concept was developed by workshop co-organizer and psychologist Maxwell Roberts of the University of Essex, known for, amongst other things, his unconventional redesign of the iconic London Underground map, which is based on concentric circles. The challenge for designers – creating simple, effective maps to tame the complexity of transport networks – therefore increases from year to year. Which information and which design is most useful to the user of the maps? To answer this, a multitude of data from different disciplines must be collected and properly linked. At the same time future data needs to be forecasted and coordinate to make informed decisions.
Martin Nöllenburg: “By automatically evaluating maps with meaningful quality signifiers, computers can systematically create and compare a variety of options and design variations. Computers do all that in a fraction of the time it takes a person to do it. Such computer-based processes can then supply templates and design ideas catered to the specifications of card designers, from which they can subsequently produce high-quality subway maps with significantly less effort. “
Program
The two-day workshop program featured presentations of contributed original research papers as well as a number of invited position papers surveying the state of the art on various aspects of schematic mapping. The workshop scientific program was comprised of 20 presentations, including software presentations, position papers, and demos. Further, five breakout activities stirred discussions and networking among the researchers and practitioners of this interdisciplinary workshop. The workshop hosted also an exhibition of posters summarizing ongoing research projects as well as new designs of schematic maps at the U2xU5 Infocenter of Wiener Linien, which is hosting an exhibition with information on the planning, construction and operation of the new subway routes. The detailed program here.
Best Poster Award
Elitza Vasileva and Hsiang-Yun Wu: OptiRoute: Interactive Maps for Wayfinding in a Complex Environment
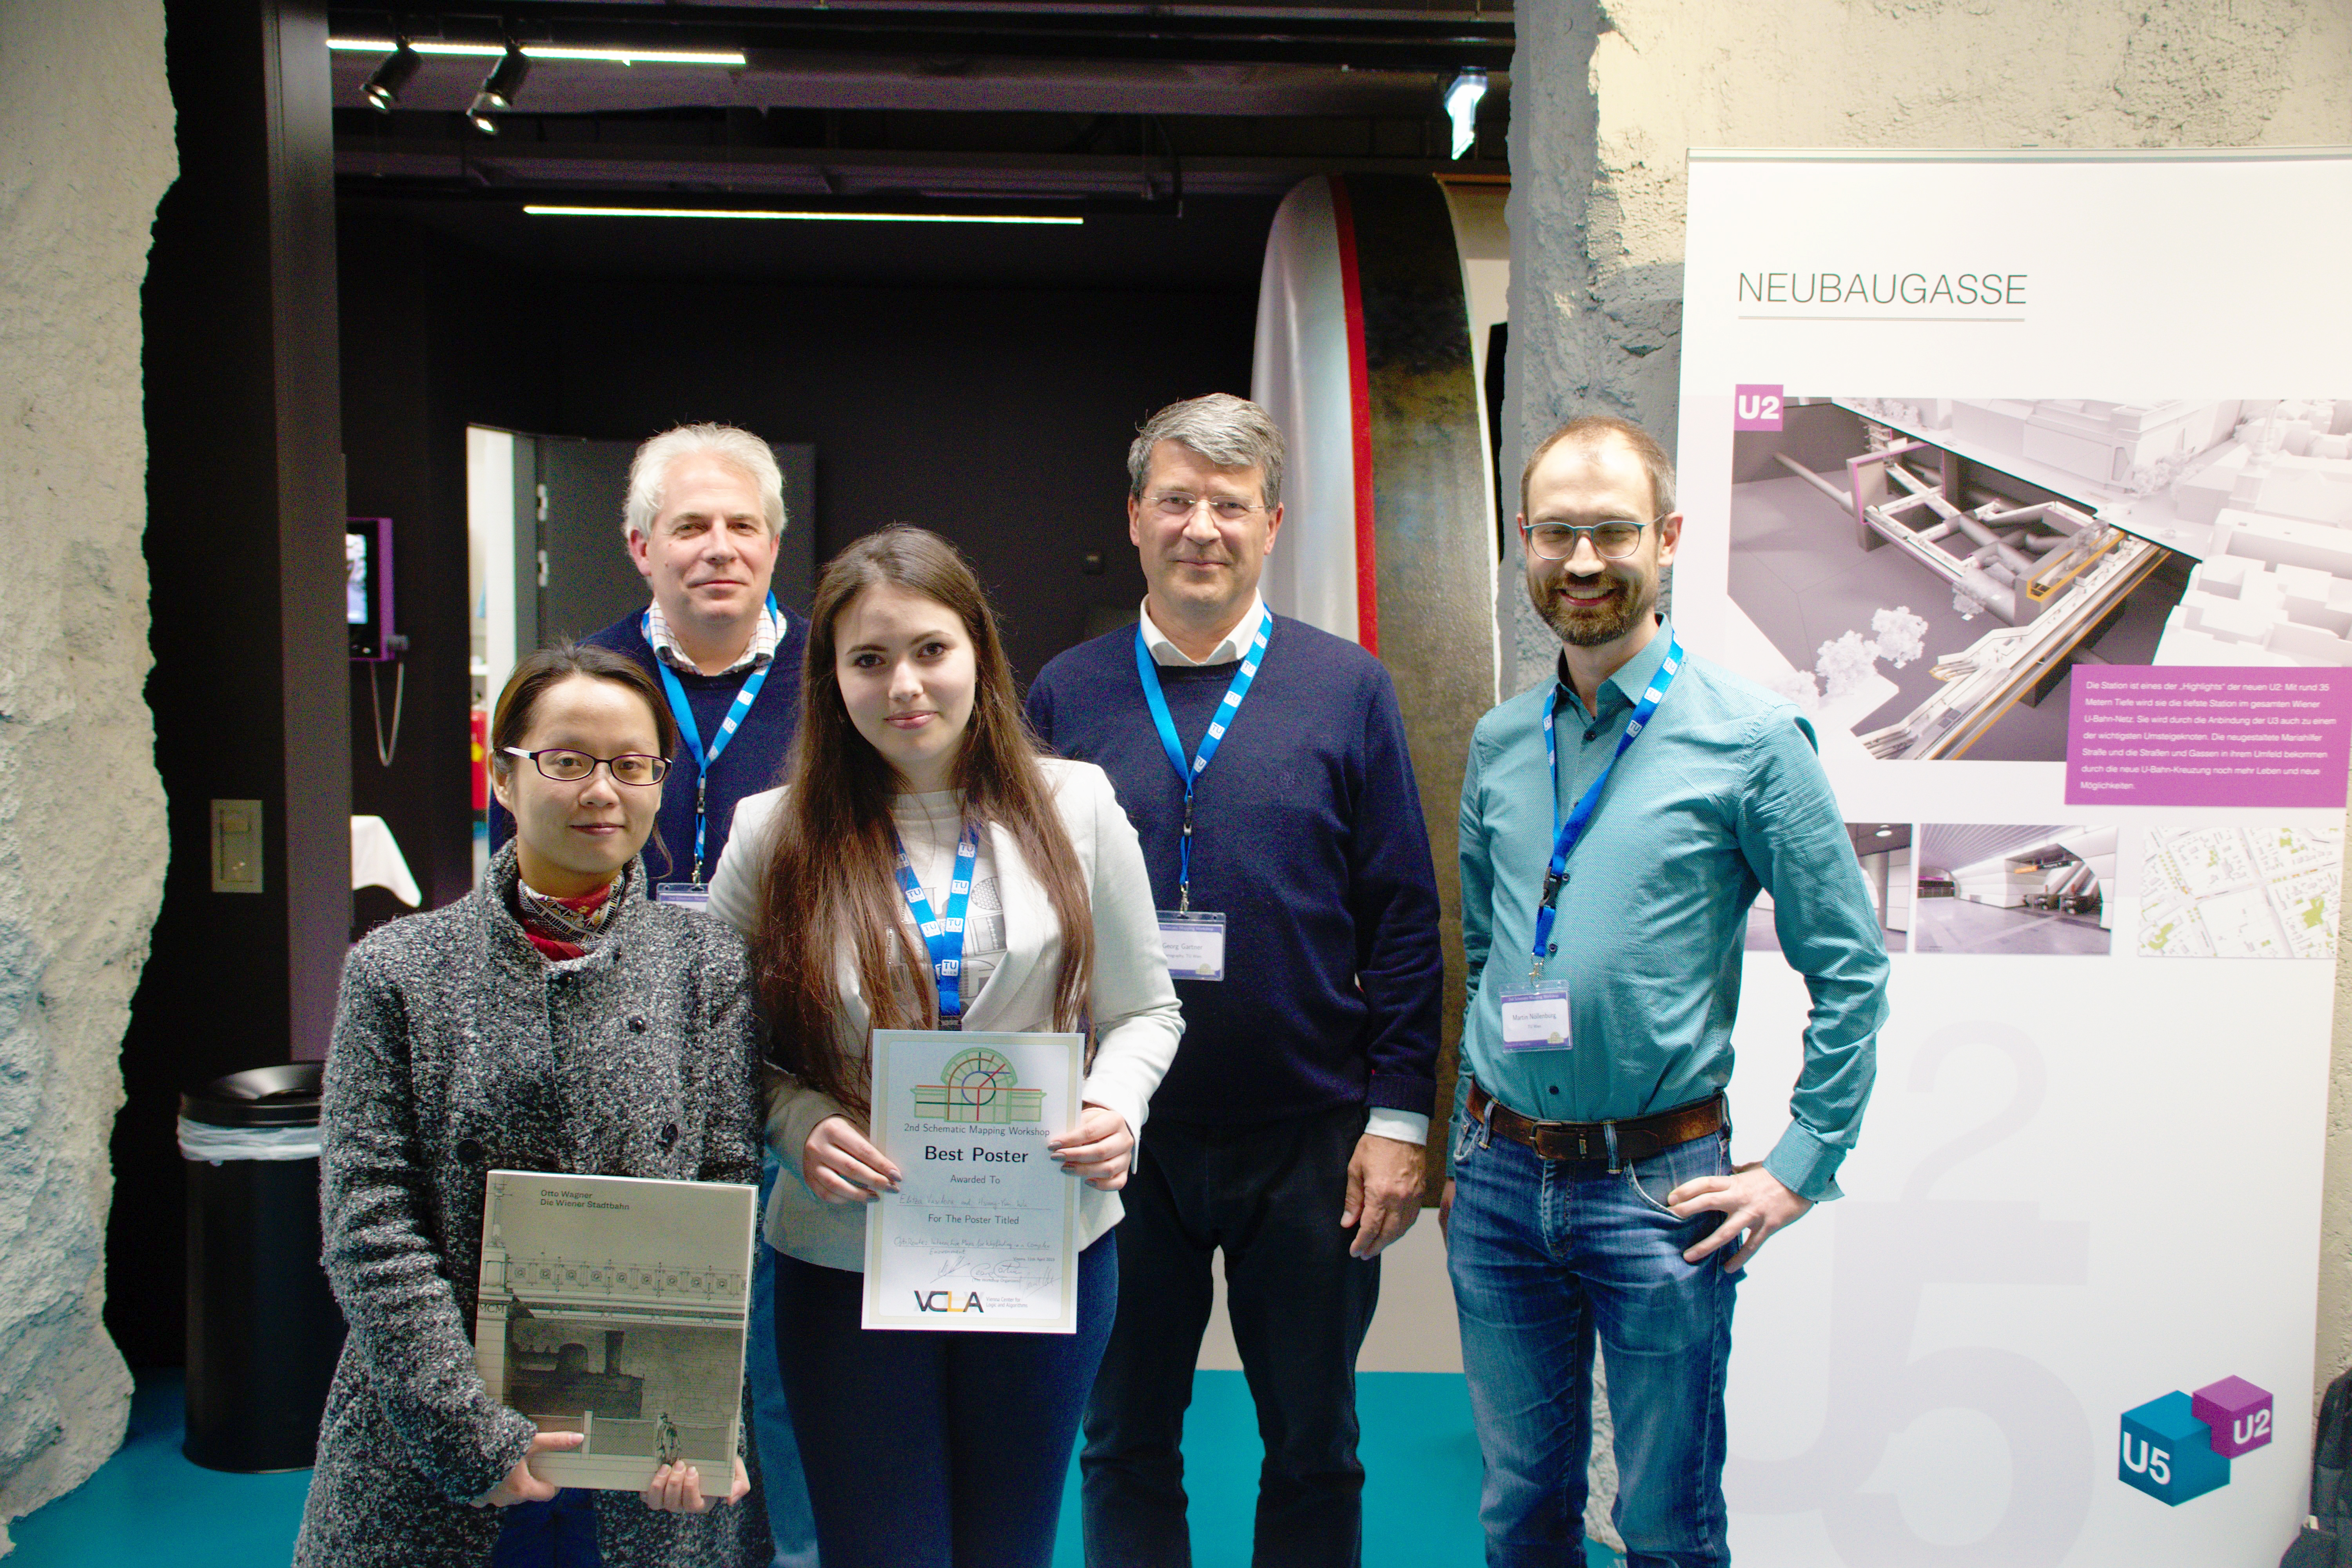
Best Poster Awardees, Hsiang-Yun Wu and Elitza Vasileva, with Maxwell Roberts, Georg Gartner, and Martin Nöllenburg
Best Presentation Award
Soeren Nickel: Drawing k-linear Metro Maps
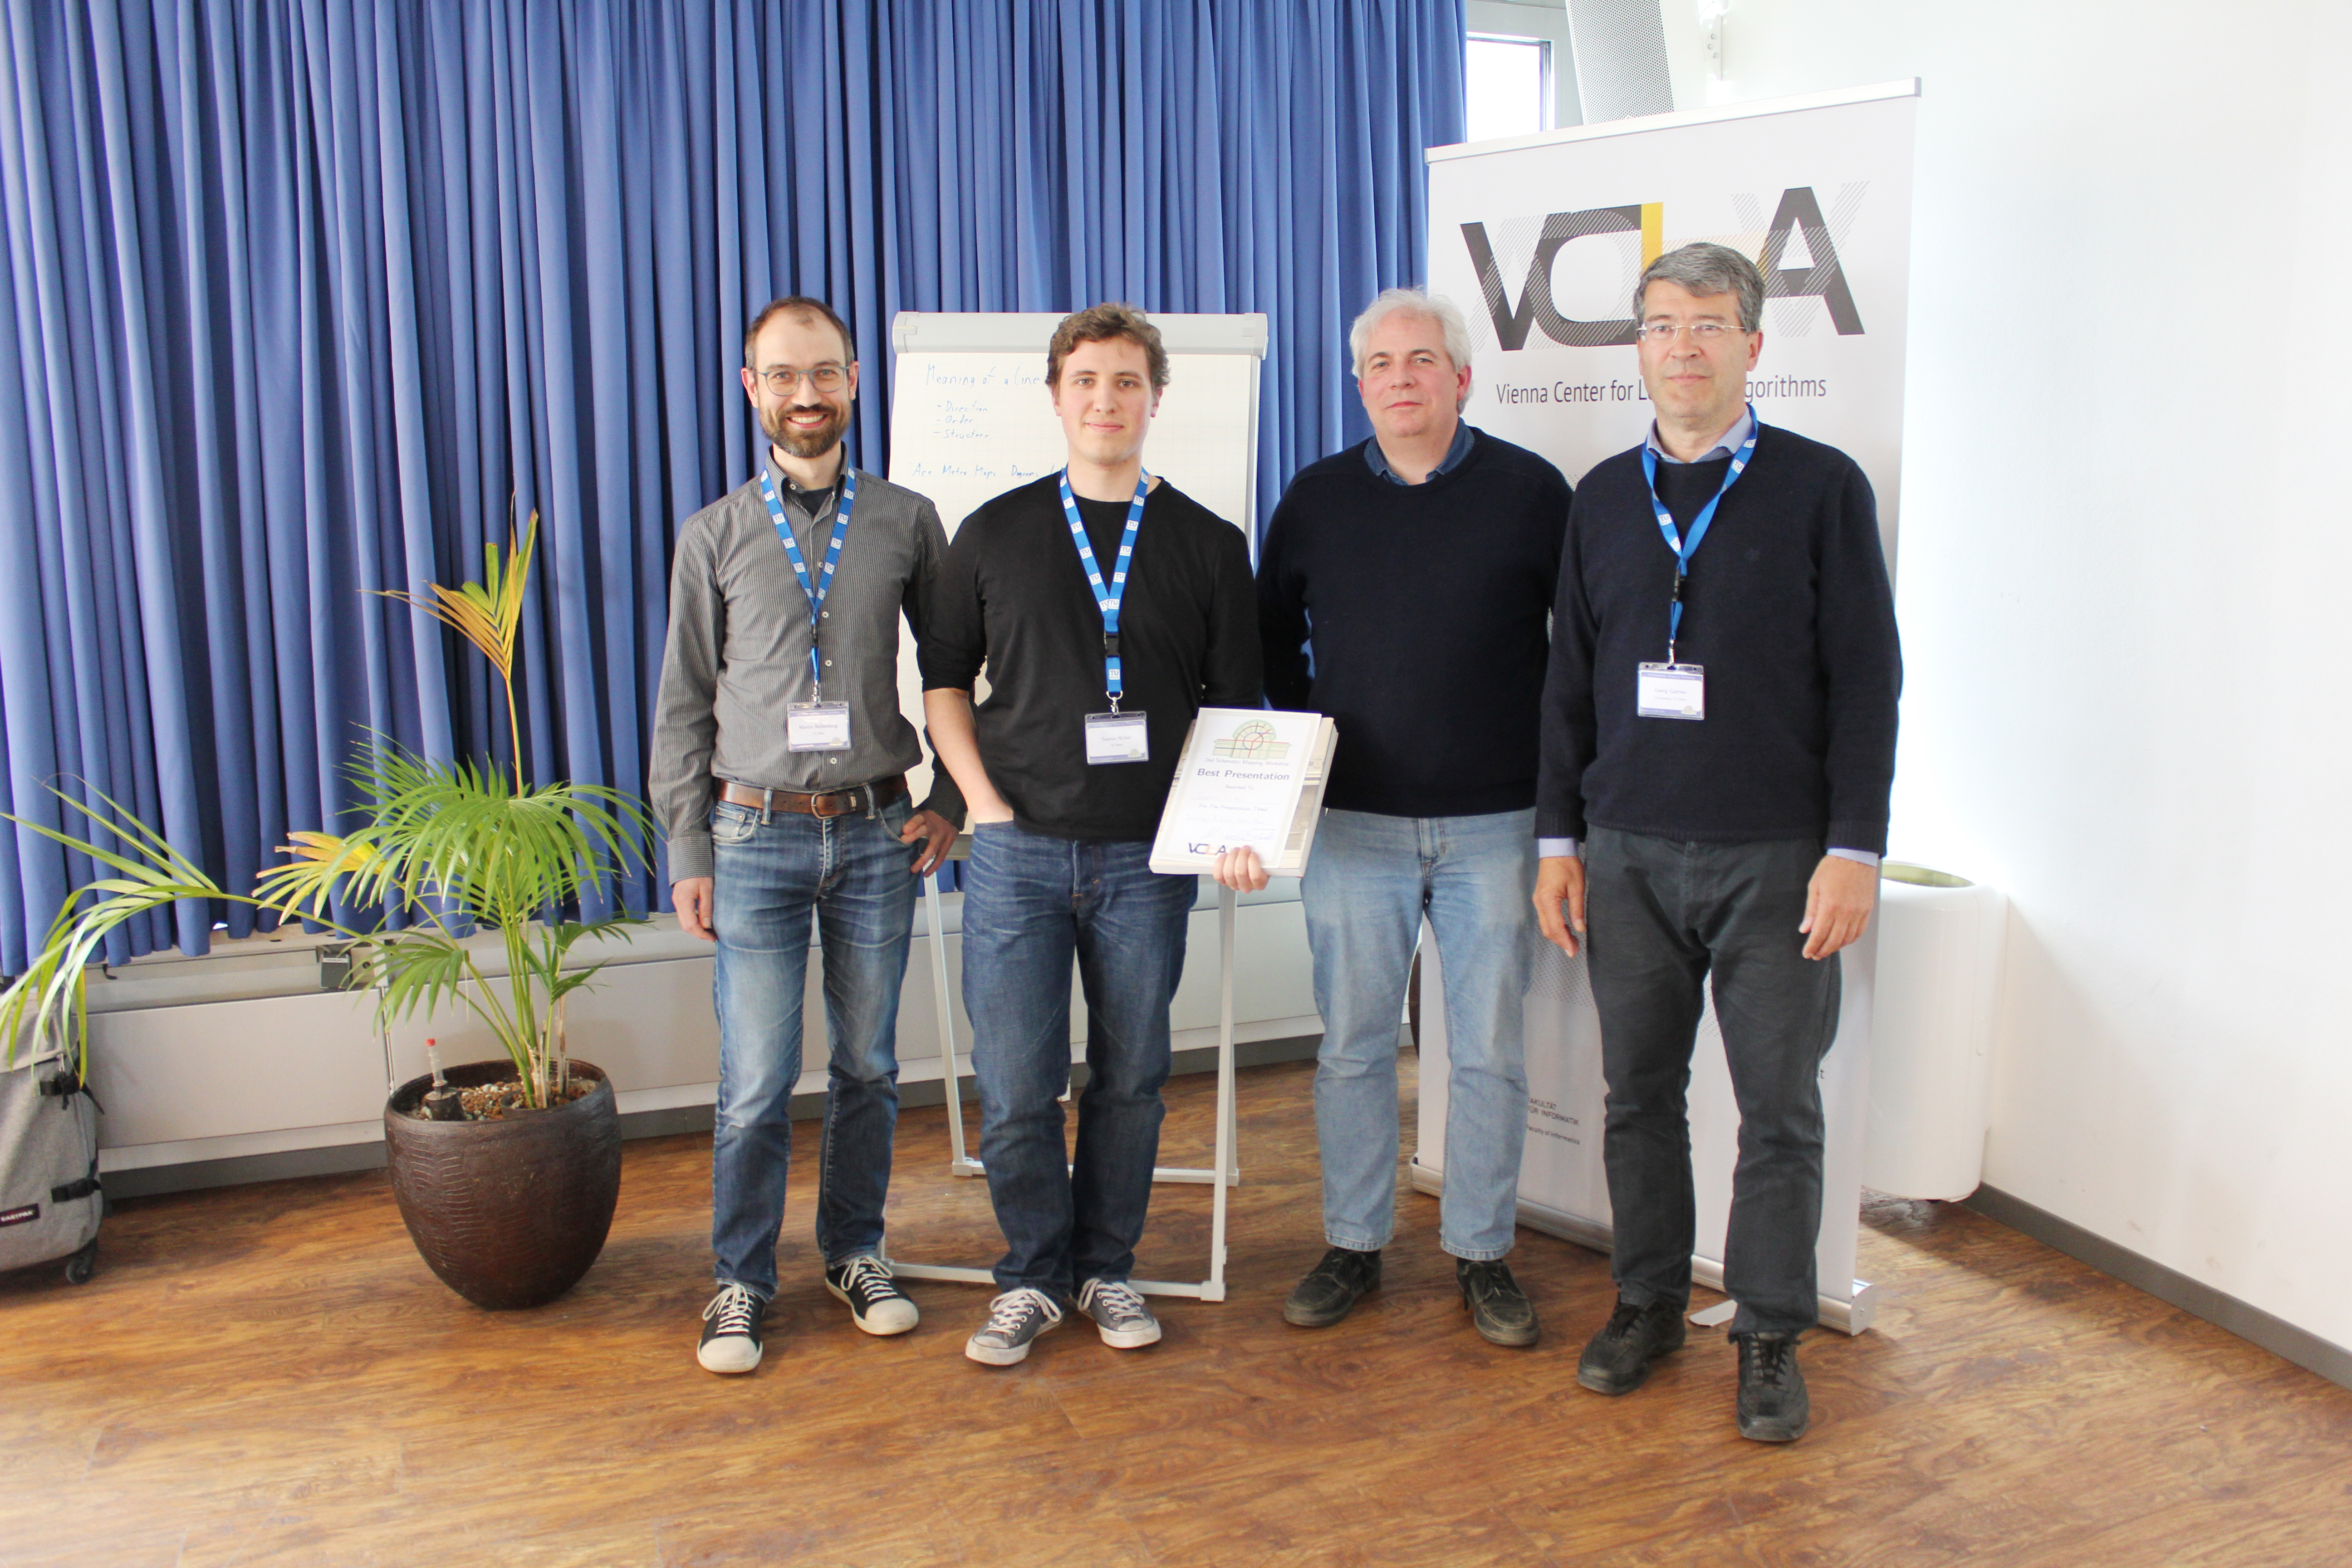
Martin Nöllenburg with Best Presentation Awardee, Soeren Nickel, and Maxwell Roberts and Georg Gartner
Photo Gallery
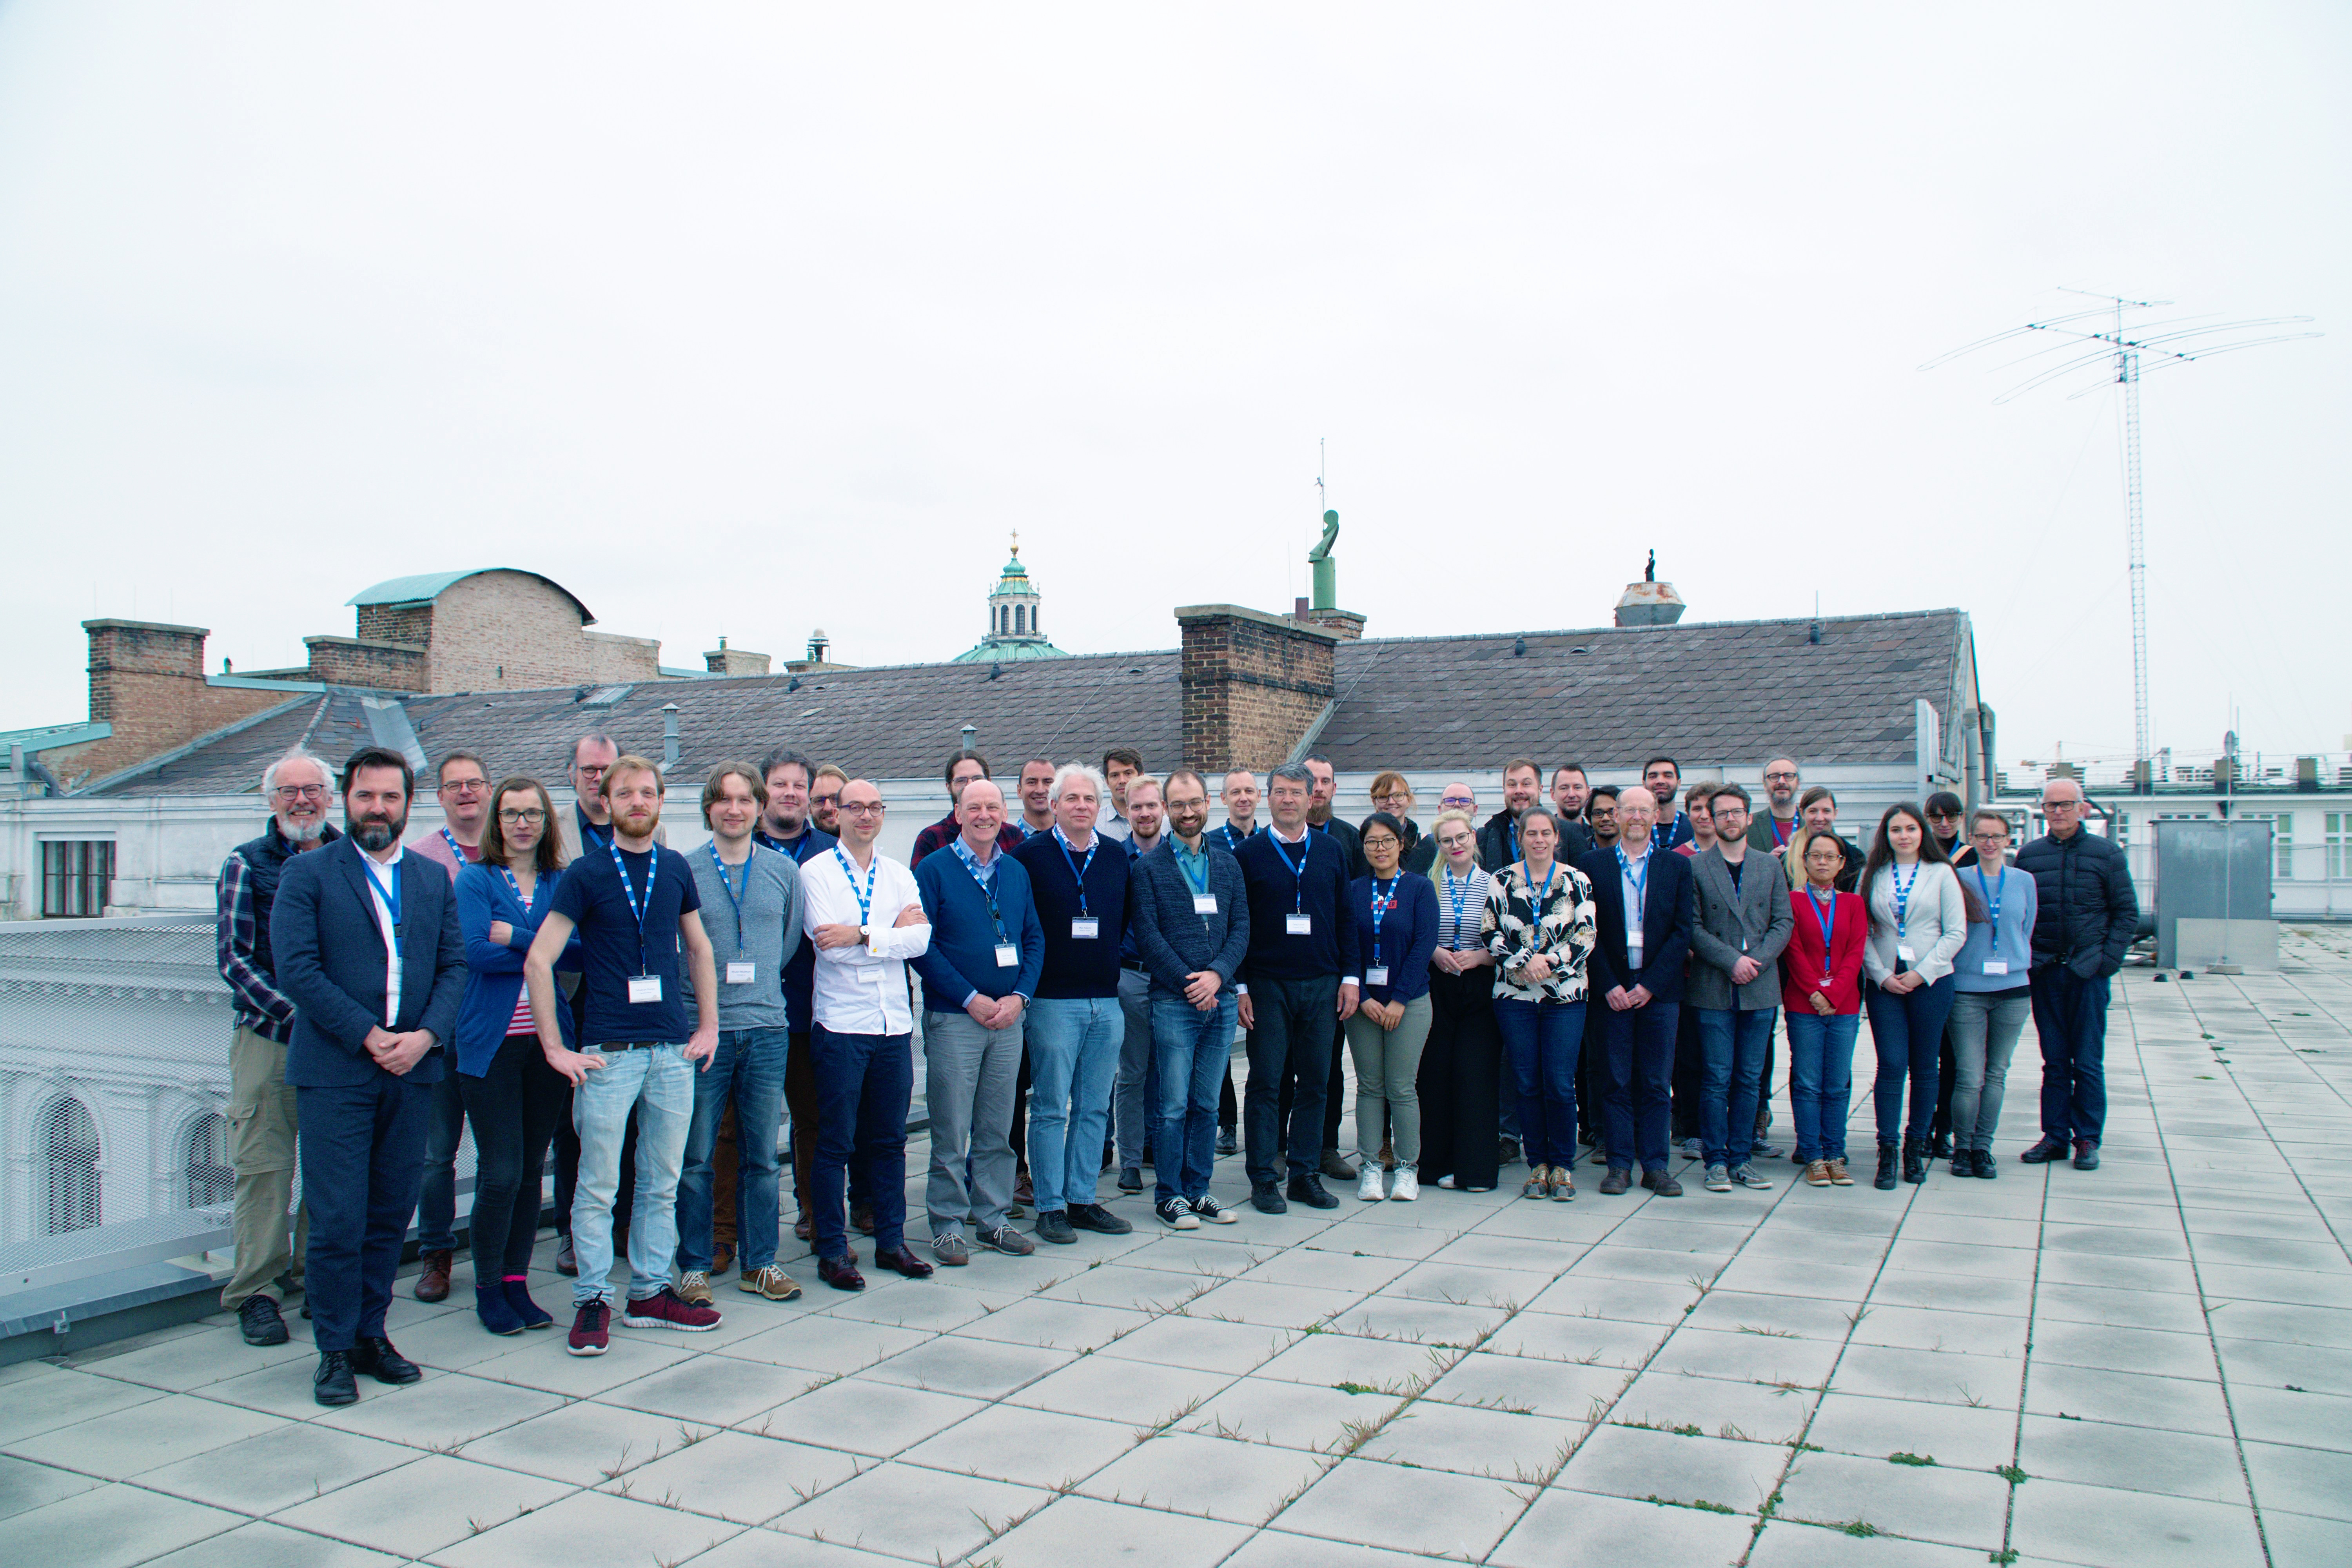 Participants of the 2nd Schematic Mapping Workshop, at TU Wien, in Vienna, Austria in 2019 |
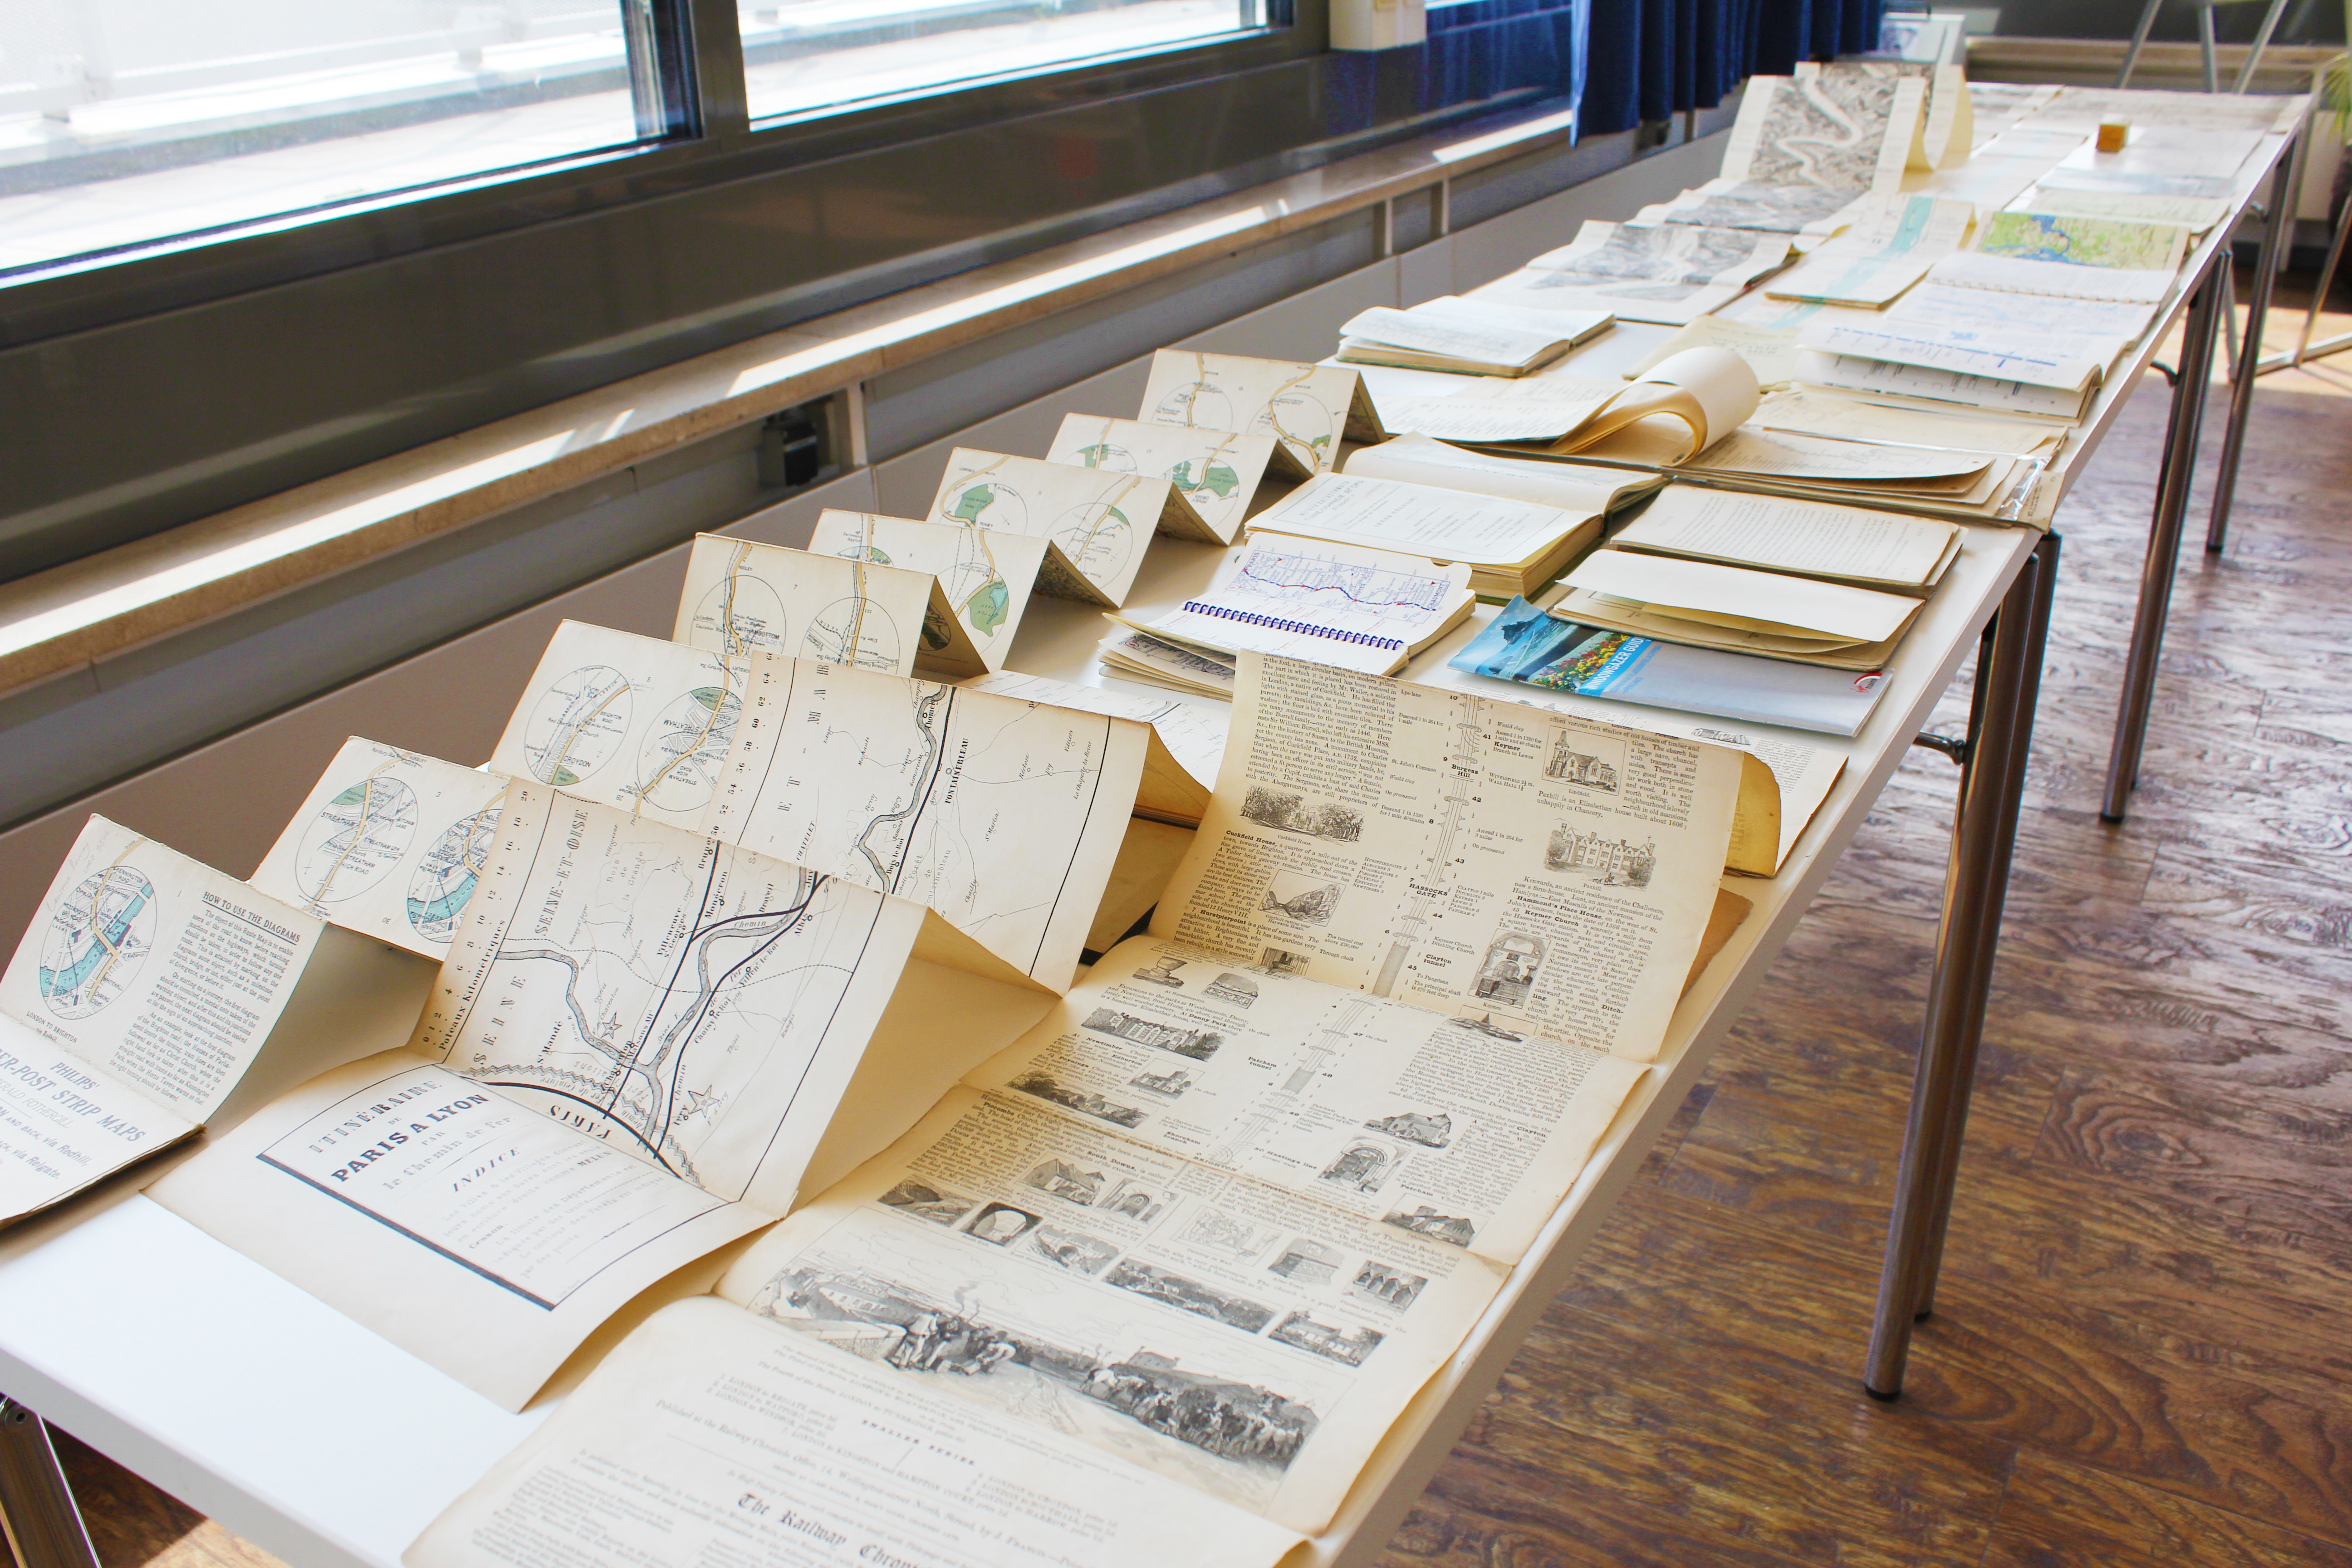 On the history of schematic maps: from ancient times to 1900 (Laurence Penney) |
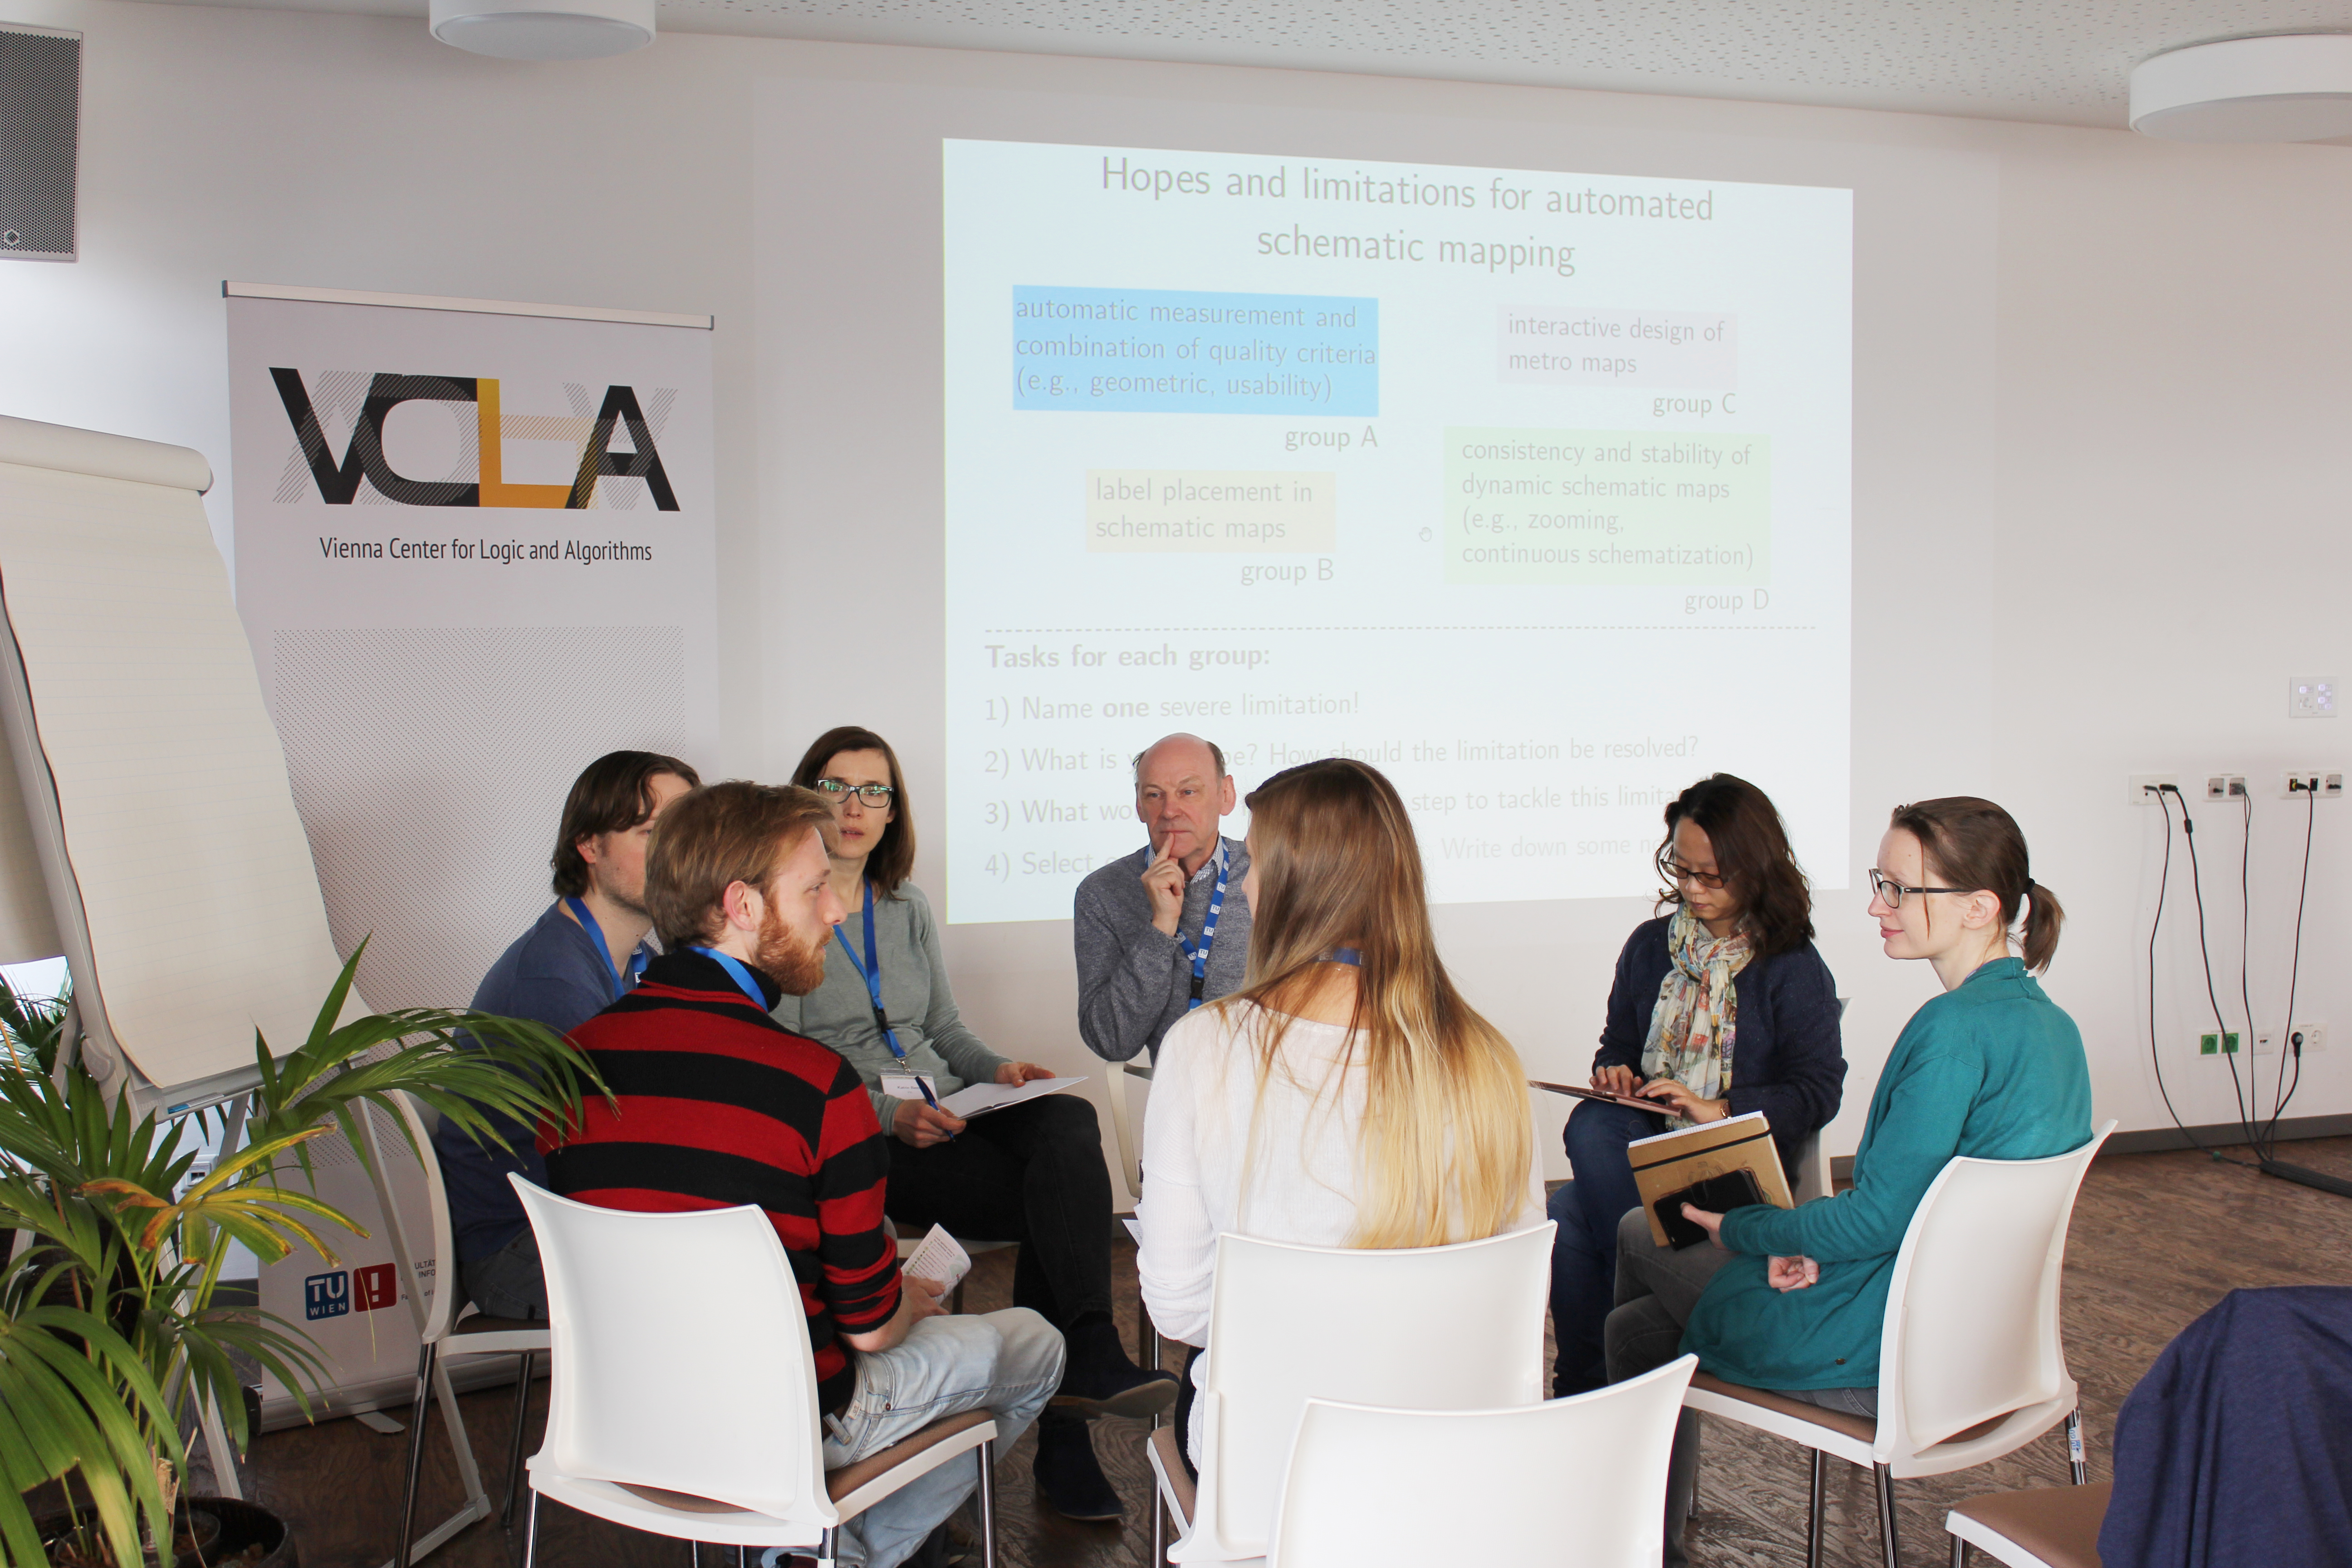 Breakout activities stirred discussions and networking among the participants from different disciplines. |
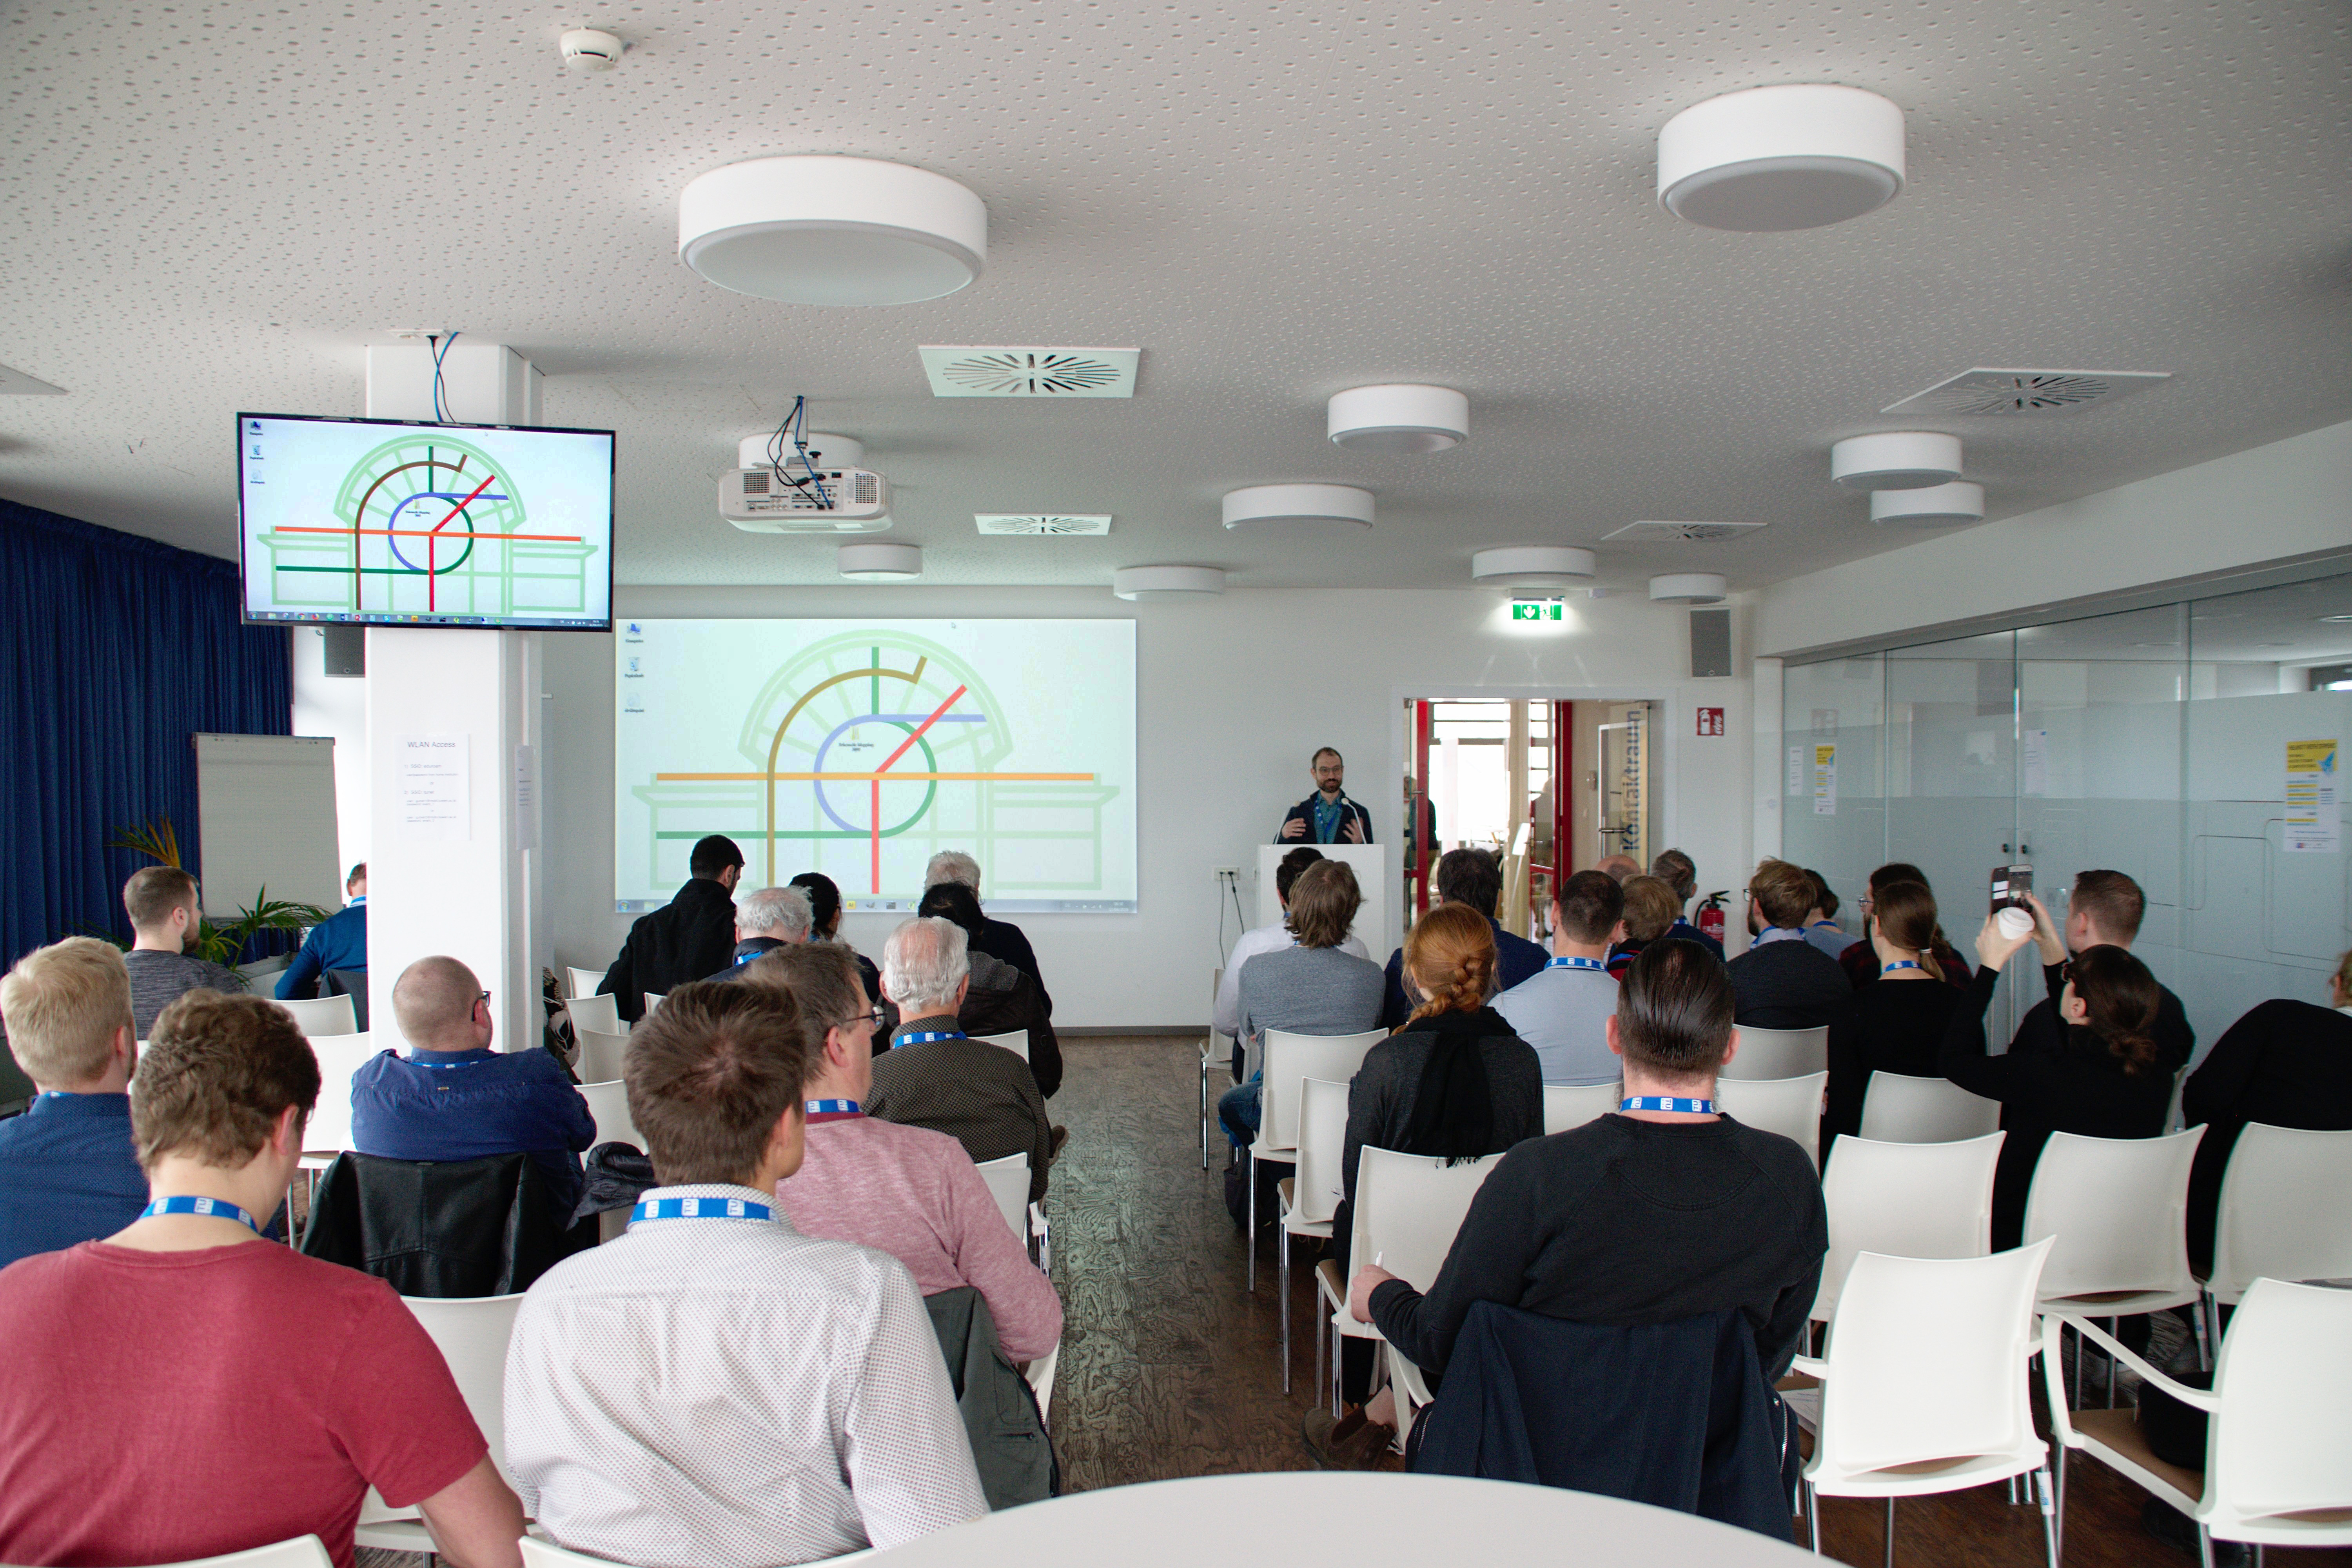 Presentations and talks at the 2nd Schematic Mapping Workshop |
 Soeren Nickel, Doris Dicklberger, Markus Wallinger |
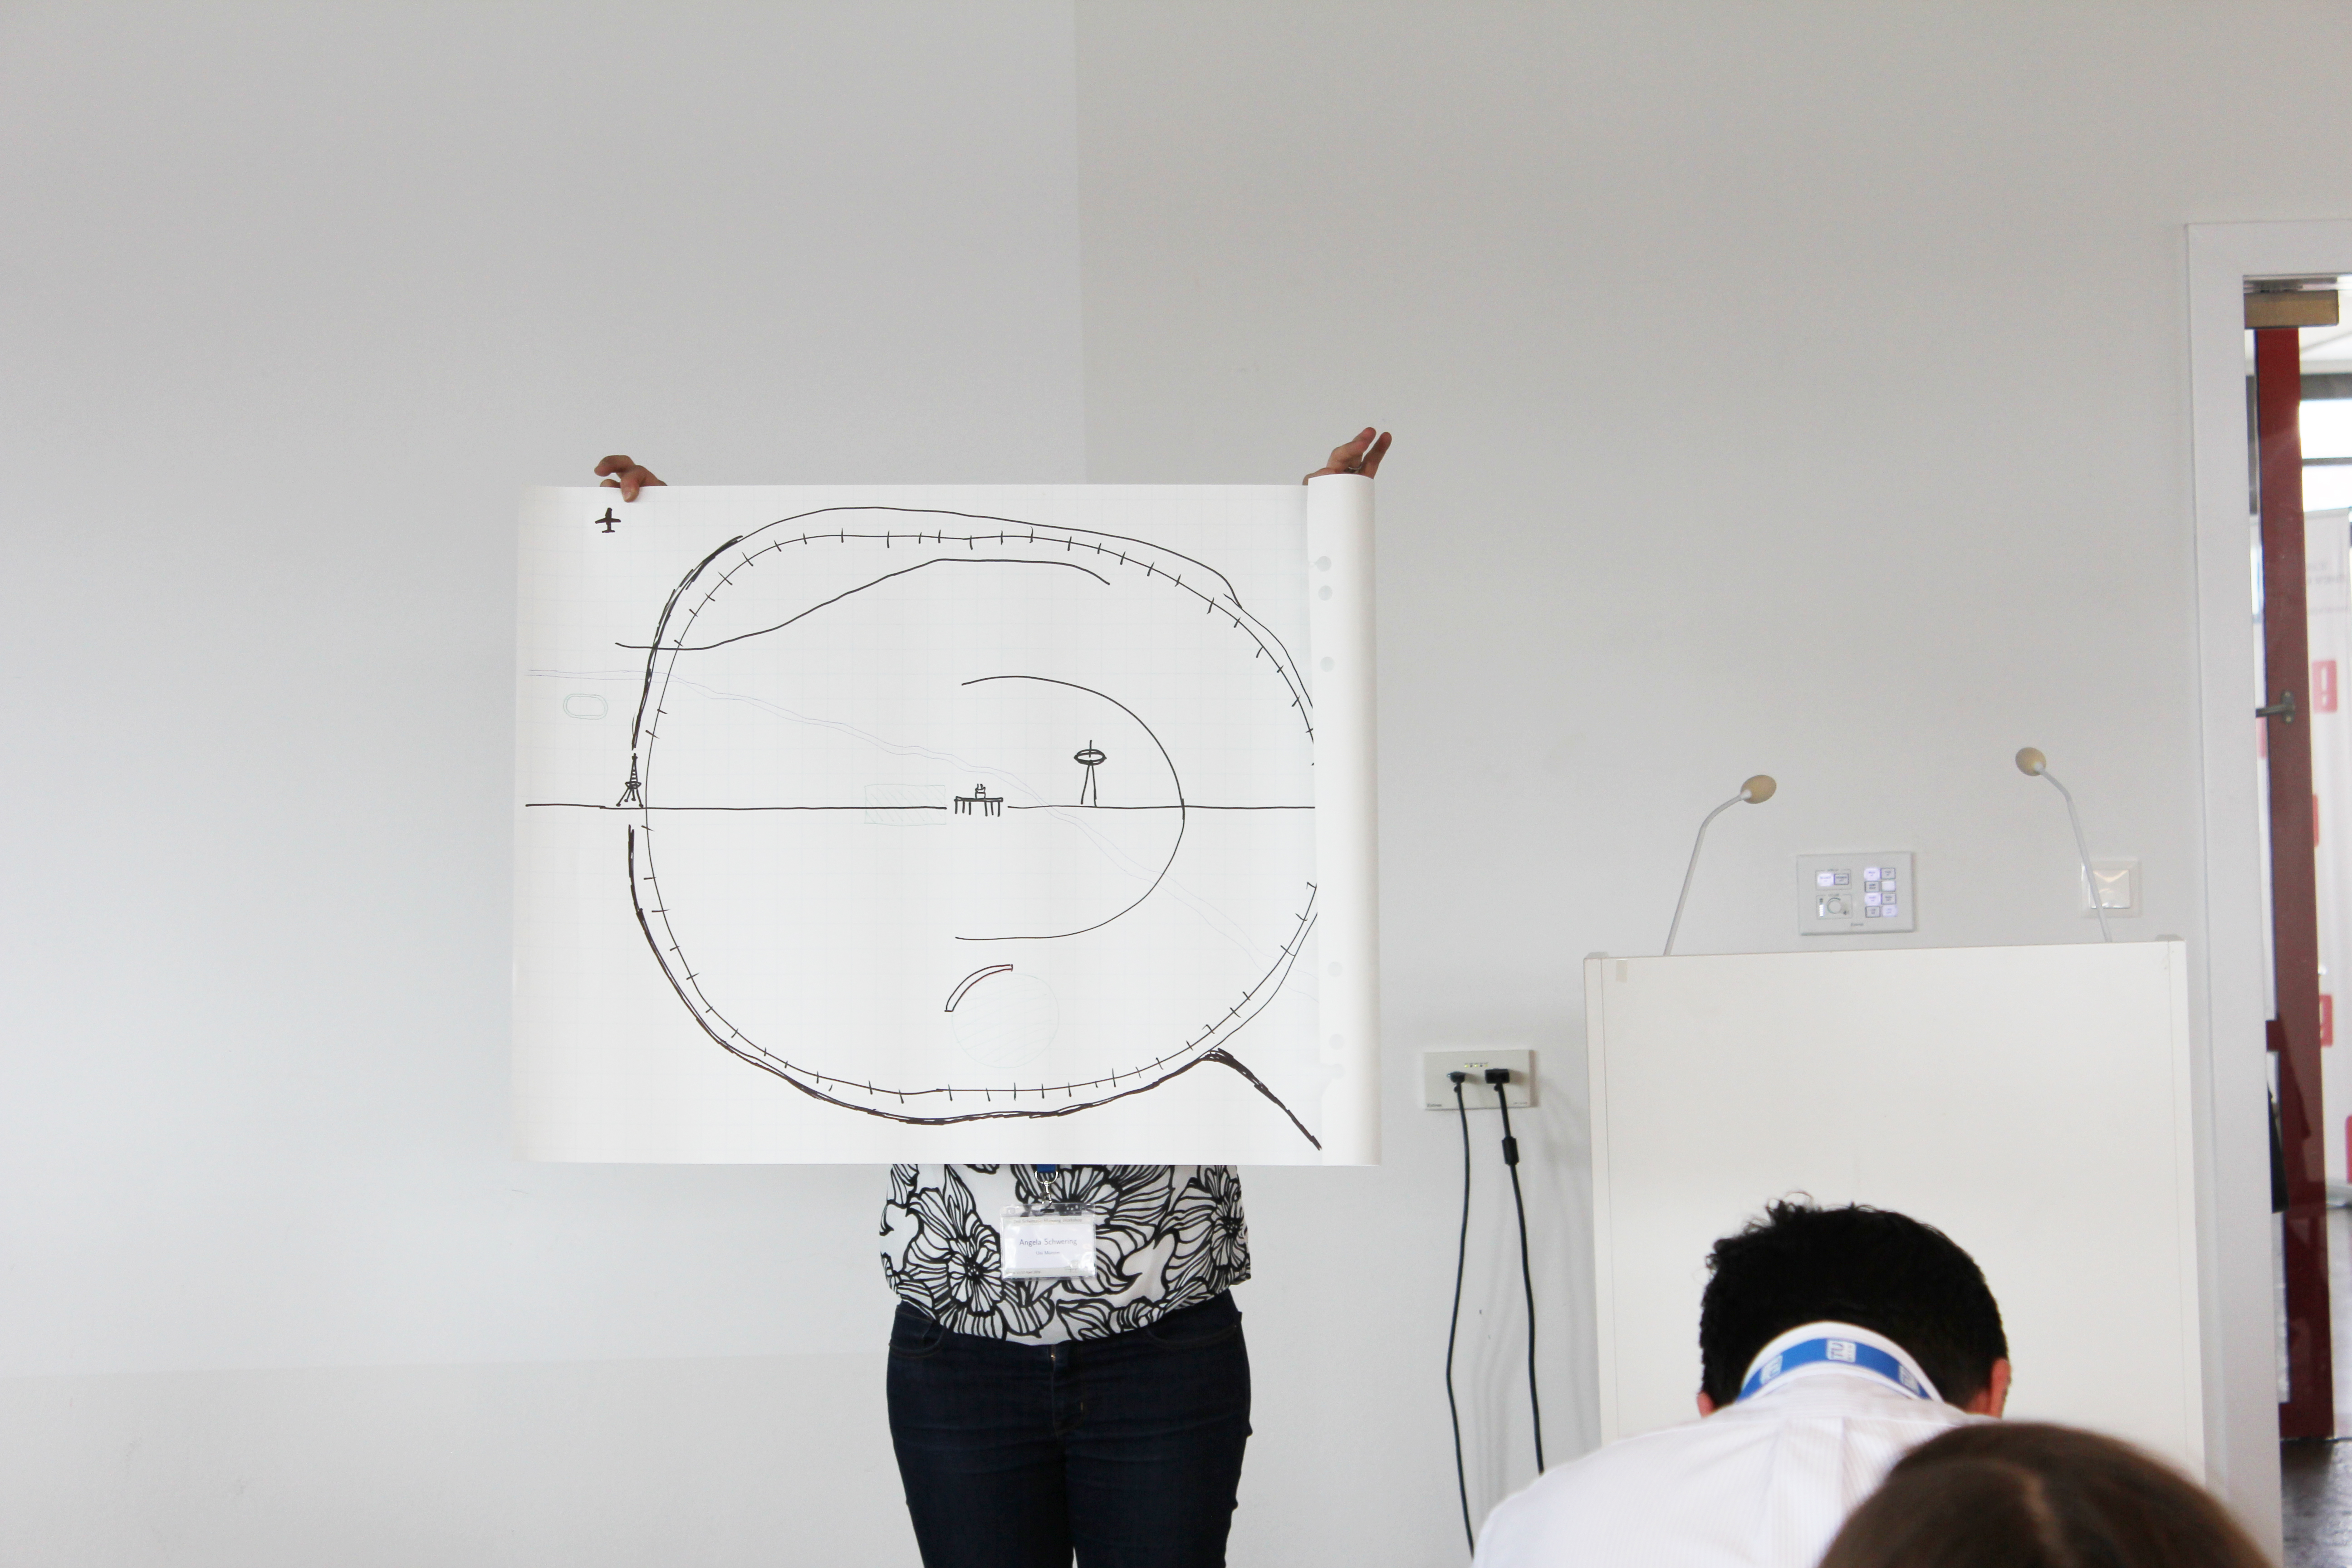 Brainstorming among participants led to creative designs. |
|
|
 The 2nd Schematic Mapping Workshop was supported by the Vienna Center for Logic and Algorithms at TU Wien and Wiener Linien |
|
Workshop Co-Chairs
Program Committee
- Linden Ball, University of Central Lancashire, UK
- David Forrest, University of Glasgow, UK
- Elise Grison, Research & Innovation SNCF & Société du Grand Paris, FR
- Zhan Guo, New York University, USA
- Bernhard Jenny, Monash University, AU
- Alexander Klippel, Pennsylvania State University, USA
- Menno-Jan Kraak, University of Twente, NL
- Wouter Meulemans, TU Eindhoven, NL
- Daniel R. Montello, University of California, Santa Barbara, USA
- Sheila Pontis, Princeton University, USA and Sense Information Design
- Angela Schwering, WWU Münster, DE
- Alexander Wolff, University of Würzburg, DE
Local Organization
- Doris Dicklberger, TU Wien
- Fabian Klute, TU Wien
- Karin Prater, TU Wien
The workshop is organized by the Algorithms and Complexity Group of the Faculty of Informatics and the Department of Geodesy and Geoinformation of the TU Wien with the support of the Vienna Center for Logic and Algorithms (VCLA) and Wiener Linien.
